Making sense of loop networks
This is a workflow on how to use AQuA-tools in a Docker or Tinker environment to cluster and annotate loops after calling them.
We will use the following AQuA tools:
Motivation
In the previous recipe, we created meaningful subsets from genome-wide loops called directly from the contact matrix. In this recipe, we’ll cluster, annotate, and visualize a subset of those loops. Clustering helps us identify interaction hubs (regions where multiple loops intersect) while annotation provides a rich summary of the genes, regulatory elements, and chromatin features involved. Together, these steps provide a clear view of the functional 3D organization of the genome.
In this recipe, we’ll use the following sample:
sample1: H3K27ac HiChIP performed on the cell line K562
Chapter 0: Ingredients
I. Prerequisites
You must complete the AQuA-tools Docker installation before starting, which can be found here. Alternatively, if you have access to Tinker, AQuA-tools are already pre-installed and no installation is needed.
II. Creating a workspace
This is an optional step. We encourage users to organize their analyses into a directory structure that keeps things nice and clean.
working_directory=/home/ubuntu/container_outputsmkdir -p $working_directorycd $working_directorymkdir -p \ data \ scripts \ results \ scratchIt’s nice to have all the files you want to play with in $working_directory/data
For now, we’ll follow the steps of this tutorial by housing ourselves in $working_directory/scratch, but we recommend writing .sh scripts $working_directory/scripts and storing the results in $working_directory/results
III. Gathering necessary files
For downstream analysis, we will need a peaks file and a genome-wide loops file. We’ll assign the .bed file path to a variable name for easier calling later.
cd $working_directory/scratch
# Initialise files in variablesK562_peaks=/home/ubuntu/bed_files/K562_H3K27ac-peaks_ENCFF038DDS_hg38.bed
For the genome-wide loops .bedpe files, you must either run the last chapter in Recipe 01 - Calling Loops From a Sample or have access to the pre-computed genome-wide loop files on Docker at /home/ubuntu/genome-wide_loops. If you are using the pre-computed loop files on Docker, we’ll rename them slightly for clarity in this recipe. If you computed the files yourself in the previous recipe, no re-naming is necessary.
# To use pre-computed genome wide bedpe files on Docker
# navigate to scratch directorycd $working_directory/scratch
# K562# Make a copy in our scratch directorycp $HOME/genome-wide-loops/K562_H3K27ac_gw-loops_hg38.bedpe .
# Rename filemv K562_H3K27ac_gw-loops_hg38.bedpe K562_genome-wide-loops.bedpe
IV. Defining samples
We’ll need a sample to get started. In Tinker or Docker environments, you’ll use the name of the sample as it appears on the Tinker box or Docker container.
on Tinker or Docker
sample1=K562_H3K27acNOTE: You can list all loaded samples on your Tinker box or Docker container using list_samples
Chapter 1: Clustering interaction spaces
I. Clustering a genome wide .bedpe
cluster_bedpe groups overlapping loops from a .bedpe file into clusters based on shared anchor regions. This is useful because it reveals regions of the genome where multiple loops converge, highlighting potential regulatory hubs. For more information about how cluster_bedpe works, see our Docs.
We’ll use the genome-wide loops file to create clusters to make sure we are capturing complete interaction hubs.
cluster_bedpe --bedpe K562_genome-wide-loops.bedpe \ > K562_gw-clusters.bedpeII. Subsetting clusters
Here, we’ll limit our clusters to those on chromosome 18. Since we’re working with K562_H3K27ac data, we might be interested in this region based on prior knowledge, such as the presence of super-enhancers near the long non-coding RNA DLGAP1-AS1. At the same time, subsetting makes the analysis faster and easier to follow for the purposes of this tutorial. In your own research, you may choose to keep the full genome-wide clusters, especially if you’re exploring broader patterns or unknown regions of interest.
# Keep loops present on chr18
awk '$1 == "chr18"' K562_gw-clusters.bedpe > K562_chr18-clusters.bedpe
Chapter 2: Annotating clusters
I. Annotating a clustered .bedpe file
The goal of annotate_cluster is to enrich loop clusters with biological annotations by summarizing features like signal peaks, gene types, and regulatory elements within each cluster. For more information about how annotate_cluster works, see our Docs.
annotate_cluster \ --bedpe K562_chr18-clusters.bedpe \ --sample1 K562_H3K27ac \ --genome hg38 \ --bed $K562_peaks \ > K562_chr18-annotated-clusters.bedpeNOTE: To see all the biological features that annotate_cluster adds to each cluster, just run annotate_cluster -h
II. Viewing annotations
Before continuing with our annotated clusters, let’s take a quick look at our annotated .bedpe
head -n 4 K562_chr18-annotated-clusters.bedpeThe output from the head command should look something like this (reformatted here for clarity):
| Cluster | chr | start | end | Degree | Total_sum | Range_span | Bin_span | Peak_span | Num_bed-B_peaks | Num_Alternate_TSSs | Num_lncRNA | Num_Housekeeping_Genes | Num_All_Genes(protein_coding) | Num_ENCODE-3_Enh | Num_ENCODE-3_CTCF | Num_UCSC_CpG | LncRNAs | Housekeeping_Genes | All_Genes(protein_coding) |
|---|---|---|---|---|---|---|---|---|---|---|---|---|---|---|---|---|---|---|---|
| cluster‑600 | chr18 | 2565000 | 3710000 | 41 | 21.938 | 1145000 | 495000 | 70345 | 59 | 21 | 4 | 5 | 7 | 145 | 3 | 10 | DLGAP1-AS1,DLGAP1-AS2,ENSG00000272688,MYL12-AS1 | METTL4,MYL12A,MYL12B,SMCHD1,TGIF1 | DLGAP1,METTL4,MYL12A,MYL12B,NDC80,SMCHD1,TGIF1 |
| cluster‑601 | chr18 | 8700000 | 8915000 | 1 | 0 | 215000 | 15000 | 3279 | 3 | 0 | 0 | 0 | 0 | 8 | 0 | 1 | |||
| cluster‑602 | chr18 | 9330000 | 9480000 | 1 | 0 | 150000 | 20000 | 3714 | 5 | 6 | 0 | 2 | 2 | 9 | 0 | 3 | RALBP1,TWSG1 | RALBP1,TWSG1 |
After scrolling to the right in the above table, you’ll notice the annotations produced by annotate_cluster are robust! Annotations are drawn from multiple sources, including gene types, regulatory elements, and chromatin marks, summarizing the biological content of each cluster.
III. Subsetting clusters for visualization
Next, let’s pick a cluster of interest to visualize with plot_contacts. There are many ways to look for interesting clusters! You could sort by descending values in the “Degree” column to find clusters with the most or fewest individual loops, or look for specific gene names using simple command line tools like grep. In this example, we’ll search for the cluster that contains the lncRNA DLGAP1-AS1. For more detailed exploration, we recommend downloading the annotated file and using R, Python, or your favorite analysis tool to sort, filter, and visualize cluster-level statistics in a way that best fits your research question.
# find the row that contains DLGAP1-AS1 with grep
grep DLGAP1-AS1 K562_chr18-annotated-clusters.bedpe| Cluster | chr | start | end | Degree | Total_sum | Range_span | Bin_span | Peak_span | Num_bed-B_peaks | Num_Alternate_TSSs | Num_lncRNA | Num_Housekeeping_Genes | Num_All_Genes(protein_coding) | Num_ENCODE-3_Enh | Num_ENCODE-3_CTCF | Num_UCSC_CpG | LncRNAs | Housekeeping_Genes | All_Genes(protein_coding) |
|---|---|---|---|---|---|---|---|---|---|---|---|---|---|---|---|---|---|---|---|
| cluster‑600 | chr18 | 2565000 | 3710000 | 41 | 21.938 | 1145000 | 495000 | 70345 | 59 | 21 | 4 | 5 | 7 | 145 | 3 | 10 | DLGAP1-AS1,DLGAP1-AS2,ENSG00000272688,MYL12-AS1 | METTL4,MYL12A,MYL12B,SMCHD1,TGIF1 | DLGAP1,METTL4,MYL12A,MYL12B,NDC80,SMCHD1,TGIF1 |
Next, we’ll save the coordinates for the cluster containing DLGAP1-AS1 in chr:start:end format for plotting next:
# save the coordinates of the cluster of interest to the variable range
range=$(grep DLGAP1-AS1 K562_chr18-annotated-clusters.bedpe | awk -F'\t' '{print $2 ":" $3 ":" $4}')echo $range
# chr18:2565000:3710000
Chapter 3: Visualizing clusters
I. Using plot_contacts with inherent normalization
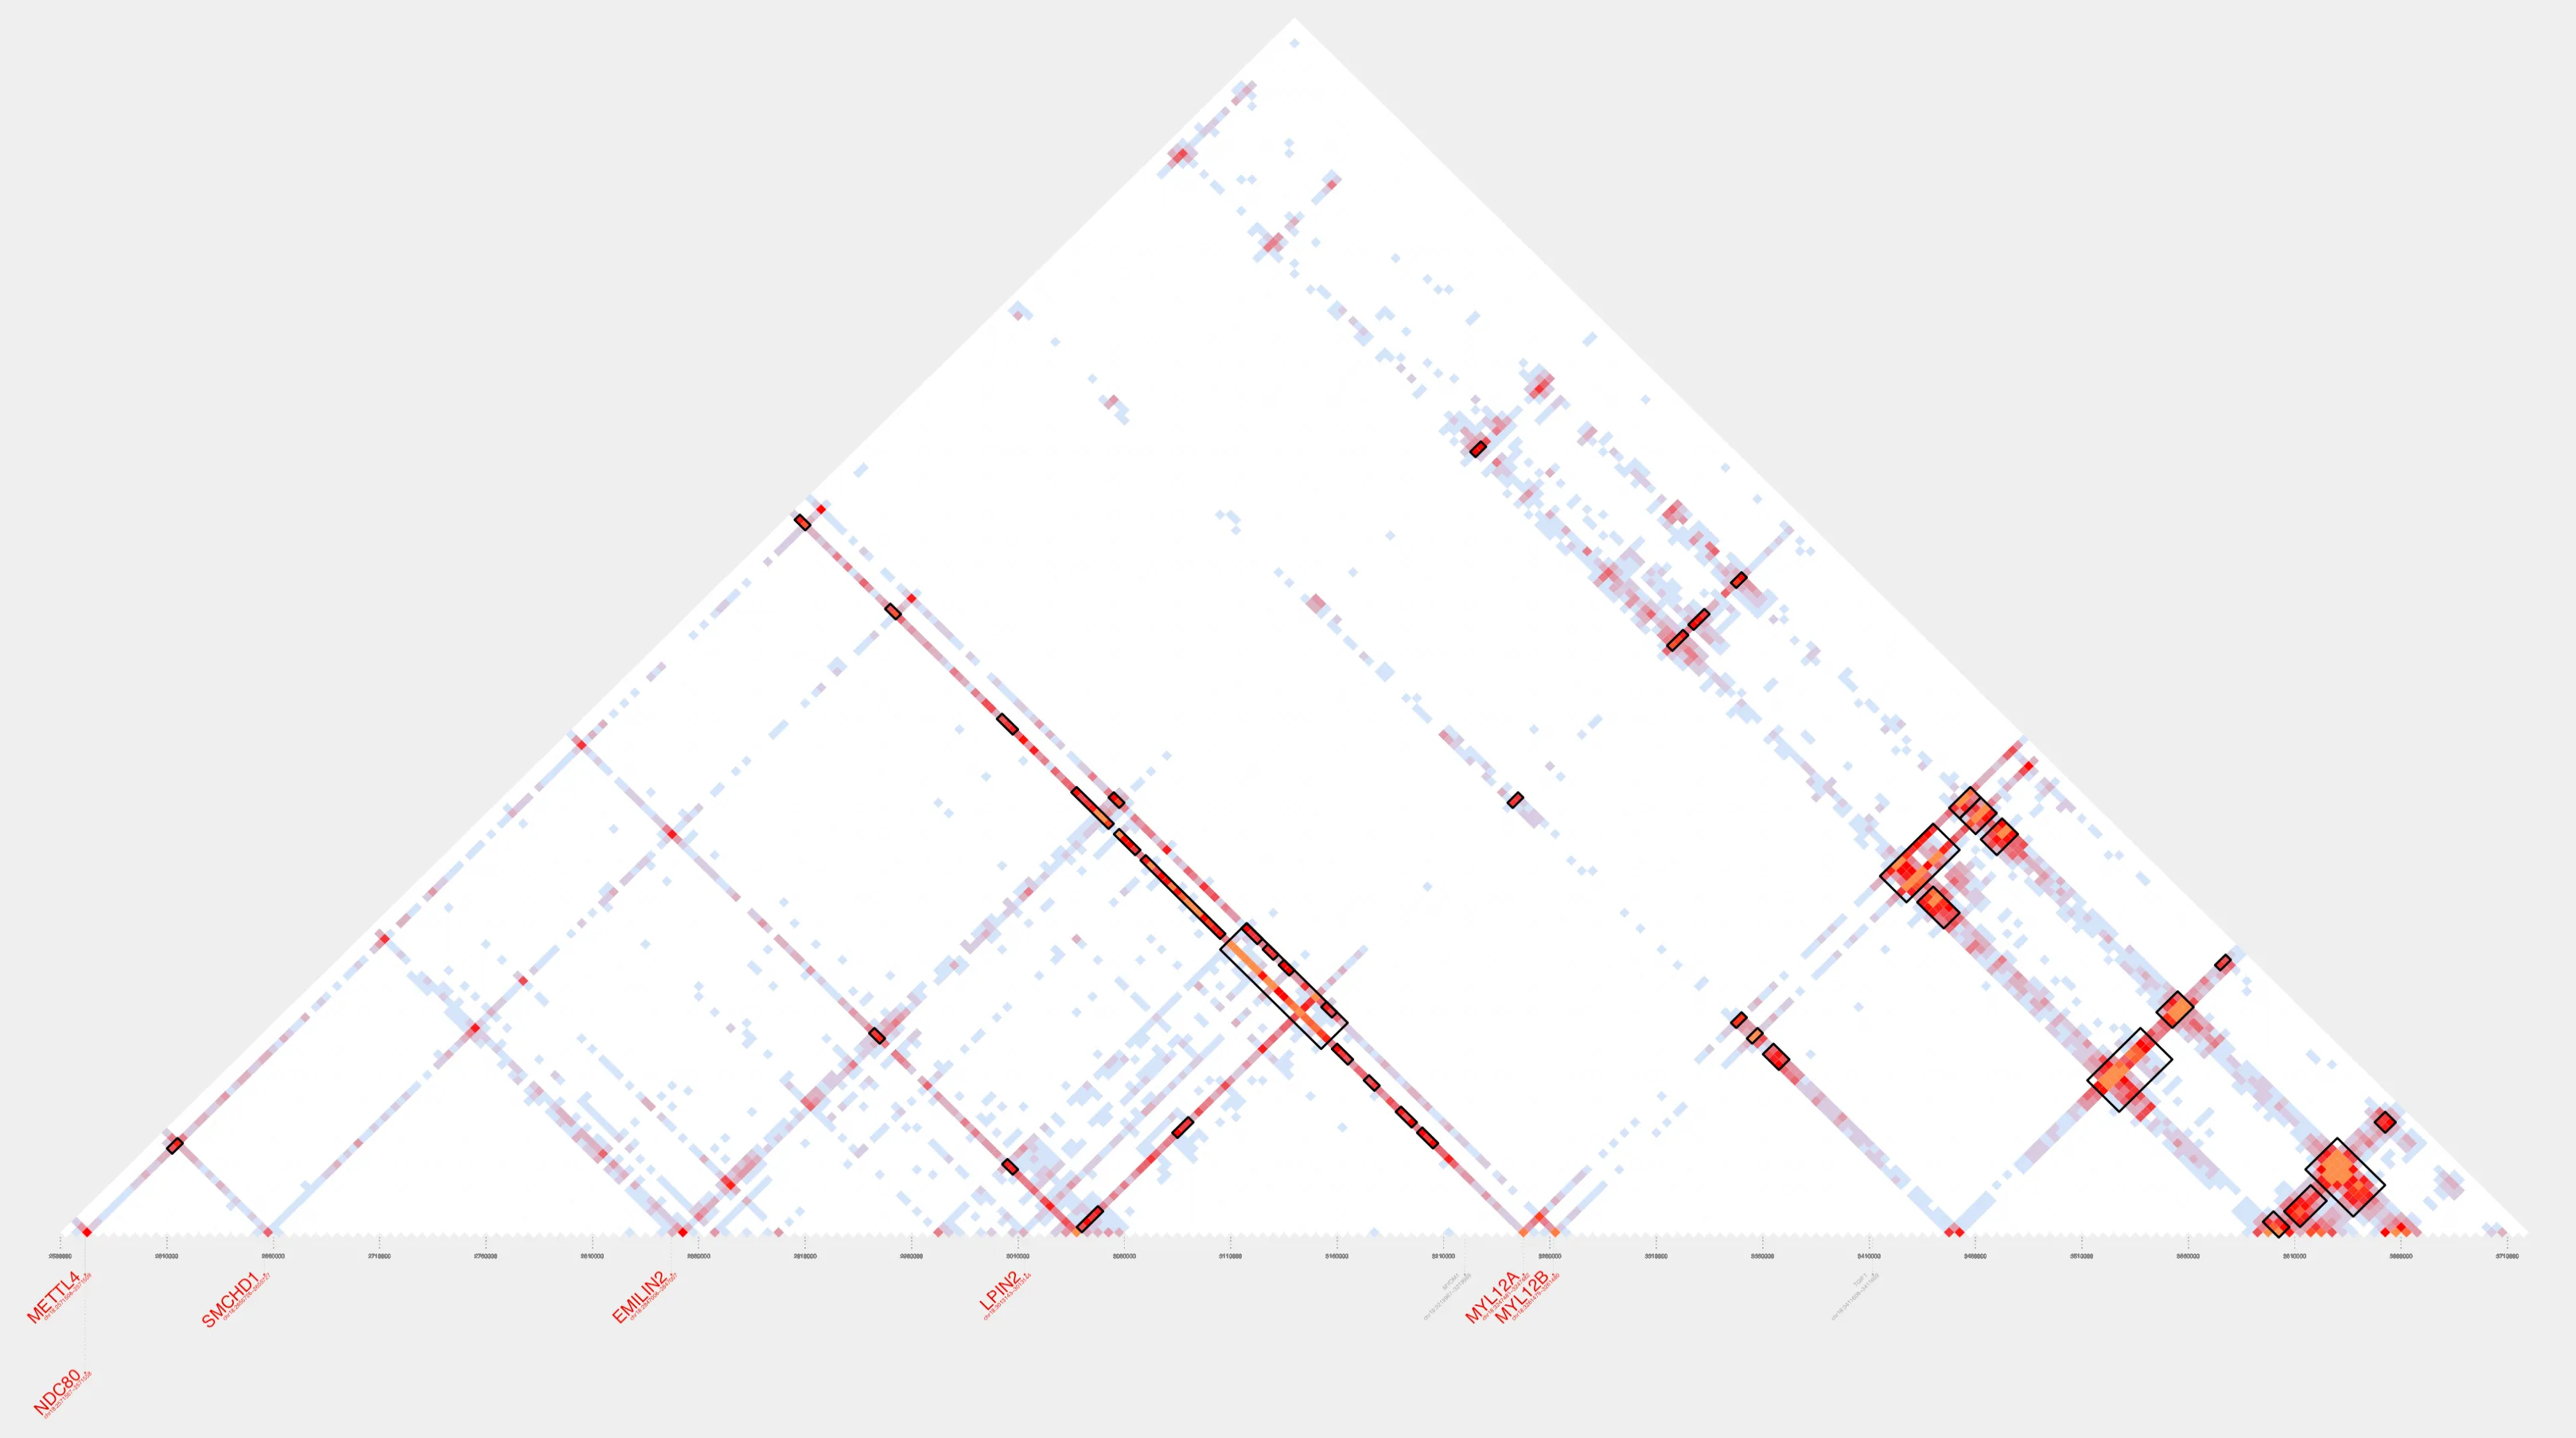
Next, we’ll visualize our selected cluster using plot_contacts. We’ll use the $range we just defined along with our clustered .bedpe file to highlight the loop clusters on the contact map. We’re also applying a small --flank value to extend our view by one bin on either side, and using inherent normalization to reduce diagonal noise and easily compare interaction strengths. For more information about how plot_contacts works, see our Docs. To know more about inherent scores, check out these Docs.
plot_contacts \ --sample1 K562_H3K27ac \ --genome hg38 \ --range $range \ --flank 5000 \ --bedpe K562_chr18-clusters.bedpe \ --inherent TRUE \ --output_name K562_chr18.pdfHere’s our cluster!

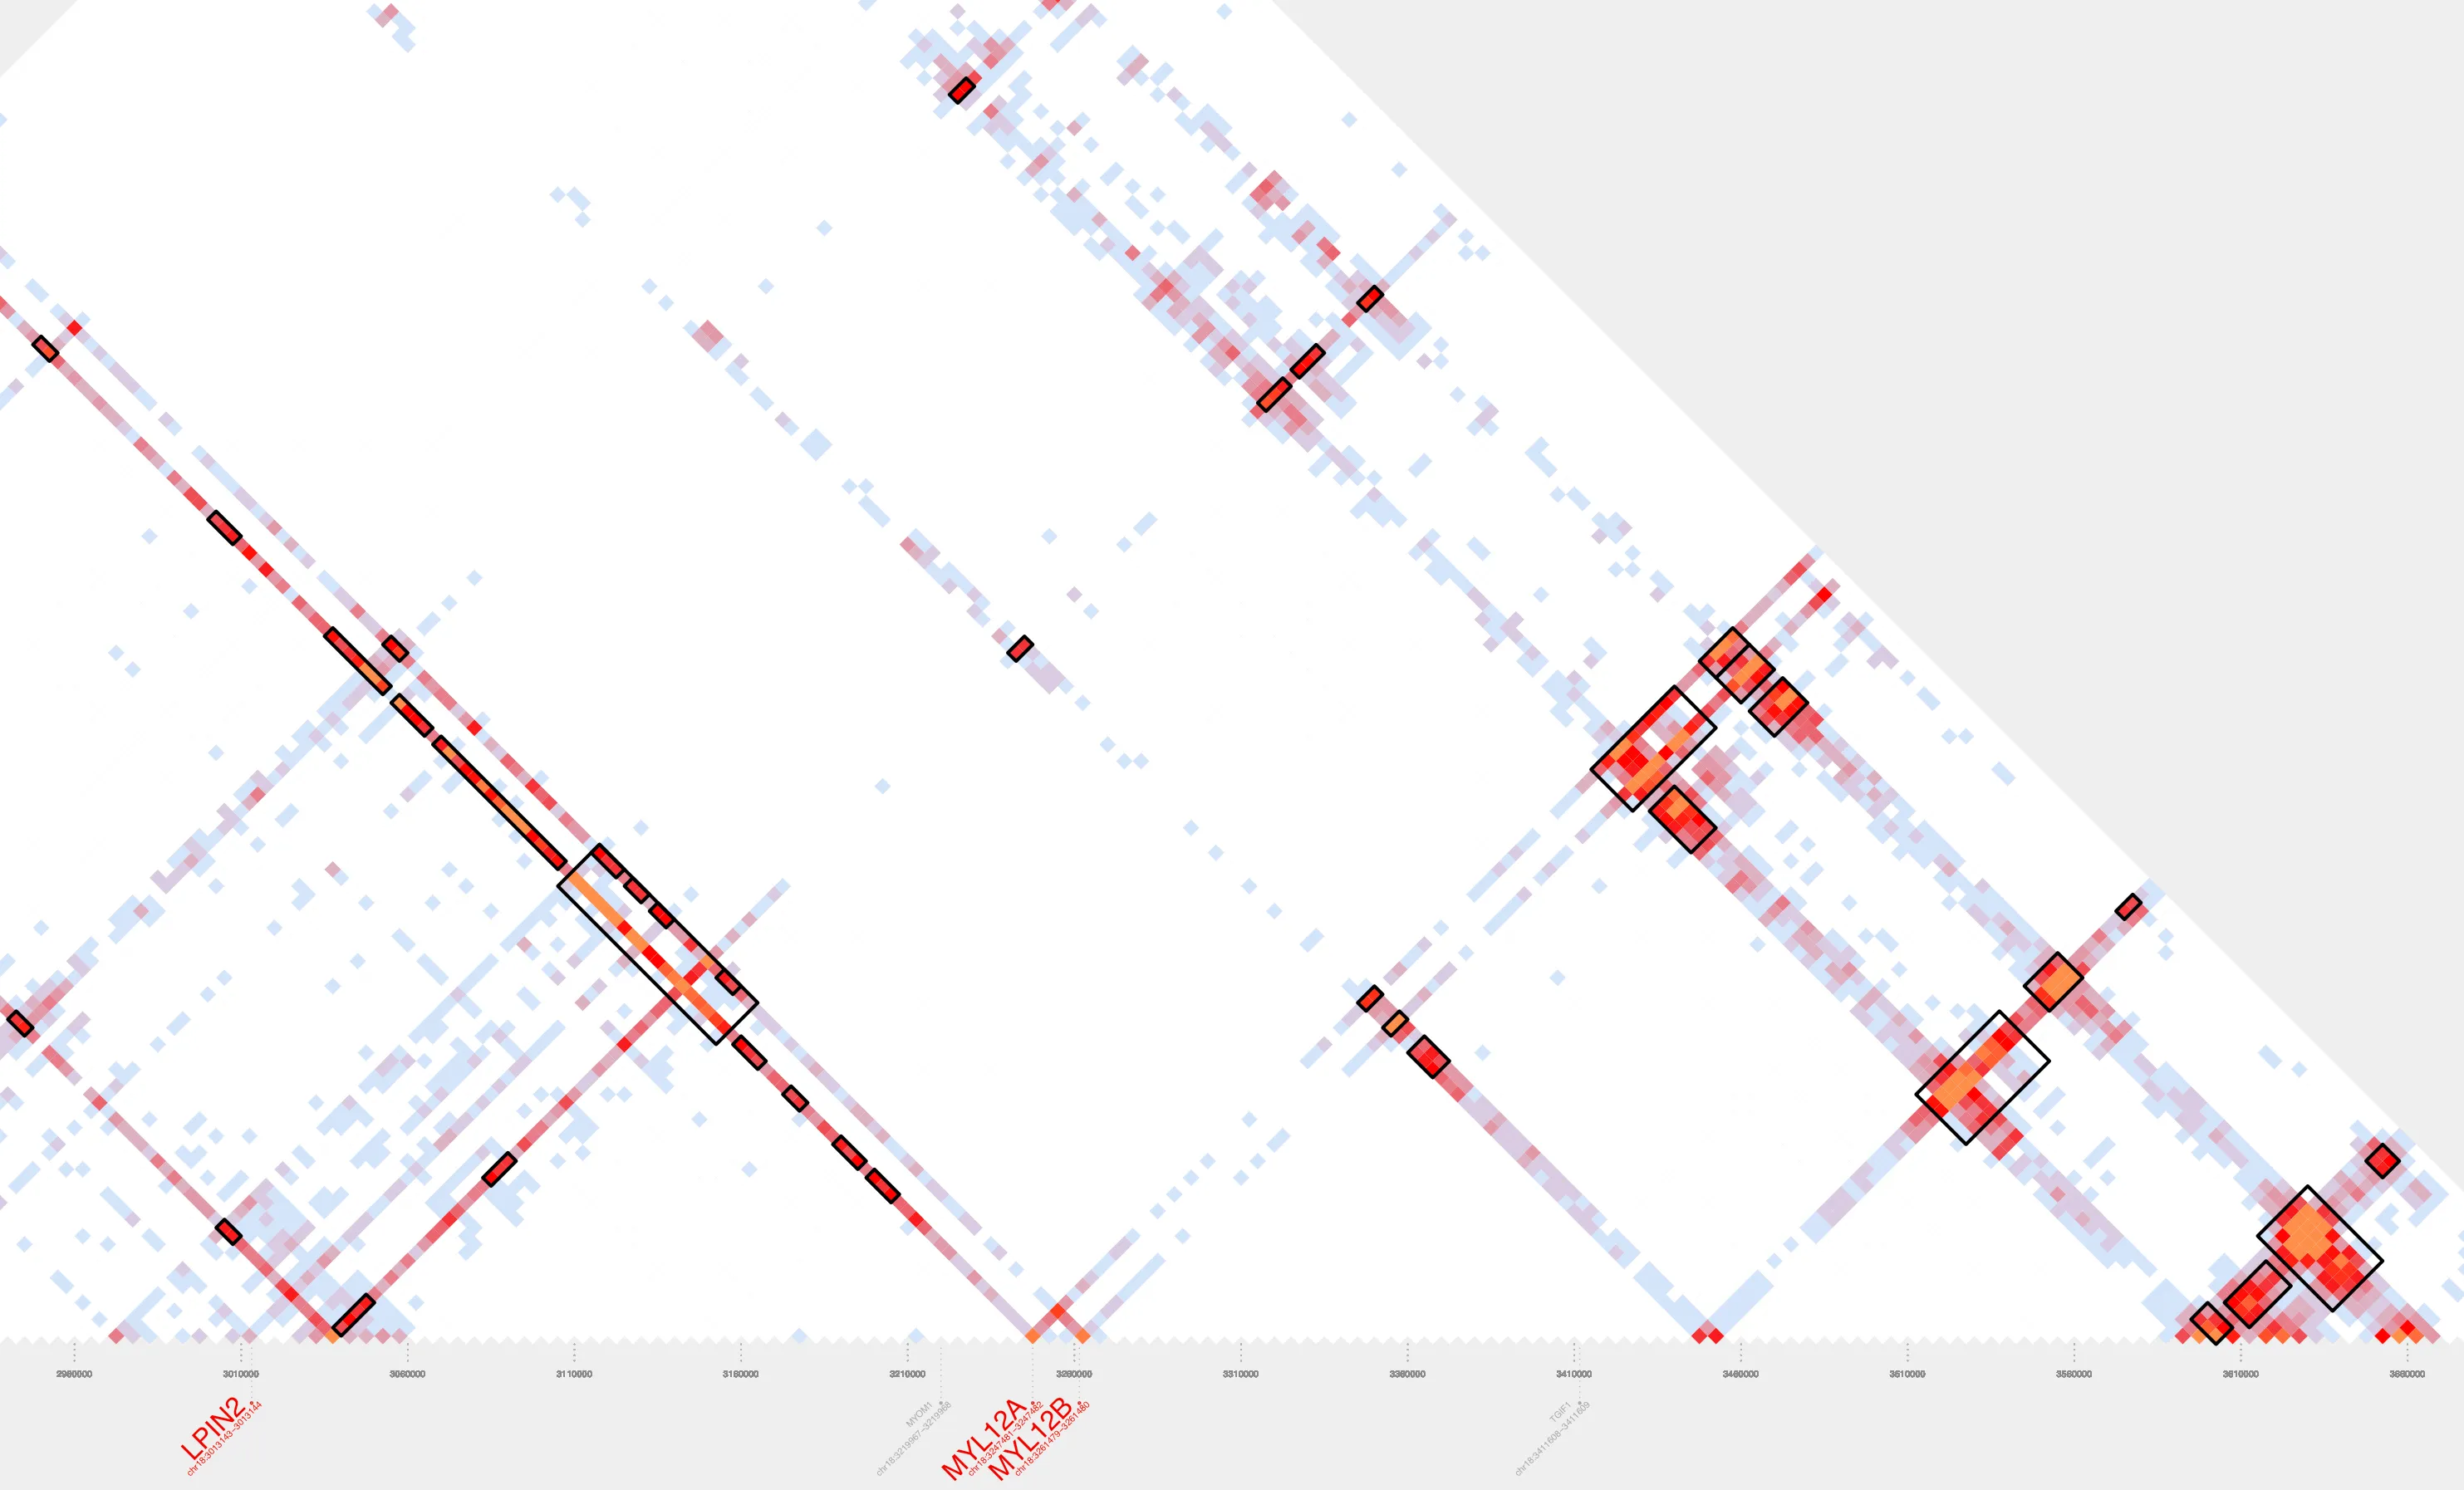
Let’s zoom in:

Conclusion
Our contact plot reveals a single cluster composed of 41 loops, all linked, either directly or indirectly, through overlapping anchor regions. Although these loops span more than a megabase of genomic space, they’re grouped into one cluster by cluster_bedpe based on this shared connectivity. Notice how the more distal loops can act as bridges, connecting otherwise separate interaction hubs into a larger, more cohesive 3D structure. This network of interactions reflects an interconnected 3D chromatin architecture.
In addition, annotate_cluster tells us our cluster of interest includes seven protein-coding genes (DLGAP1, METTL4, MYL12A, MYL12B, NDC80, SMCHD1, and TGIF1), five housekeeping genes, and four long noncoding RNAs, including DLGAP1-AS1. It is also enriched for regulatory features, with three ENCODE-3 CTCF sites, 145 ENCODE-3 enhancers, and 10 CpG islands.
From loop calling to clustering, annotation, and visualization, this entire workflow was done using just a few AQuA-tools. Our goal is to give researchers an intuitive, flexible toolkit that makes it easier to think about the genome as a dynamic, three-dimensional system.