plot_apa
Concepts
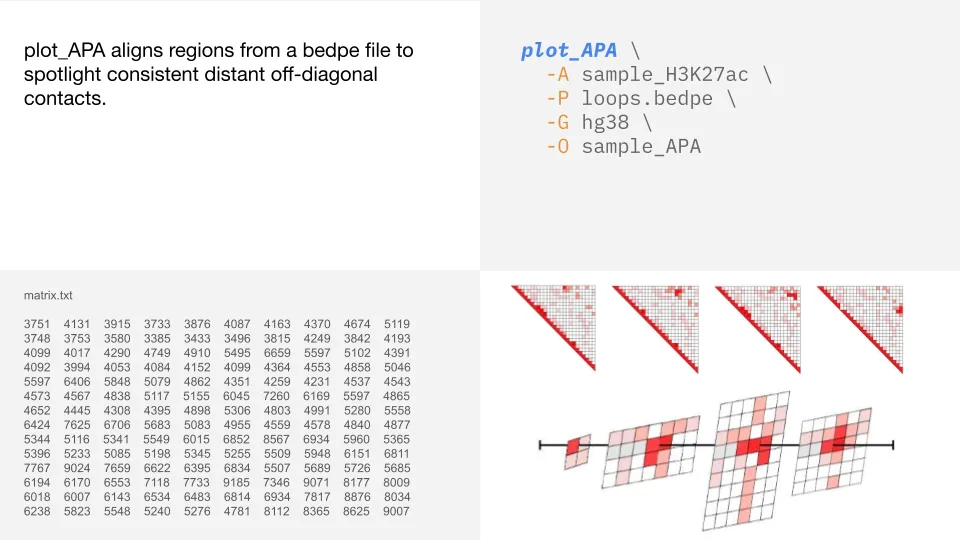
plot_APA is a visualization tool used to identify off-diagonal loops.
plot_APA is a wrapper for Juicer’s apa tool with additional customizable parameters, normalization methods, and delta comparison plot capabilities.
By default, plot_APA outputs an APA plot, a histogram of pair distances from the diagonal, and the numerical matrix used to create the APA plot.
Aligning and aggregating
The figure below illustrates how plot_APA aligns regions from a bedpe file and aggregates interactions around putative peaks,
effectively “skewering” significant off-diagonal loops for clear visualization. The code example shows how to run plot_APA from a Tinker Box,
and the matrix data of interaction strengths shows how the plot is generated.
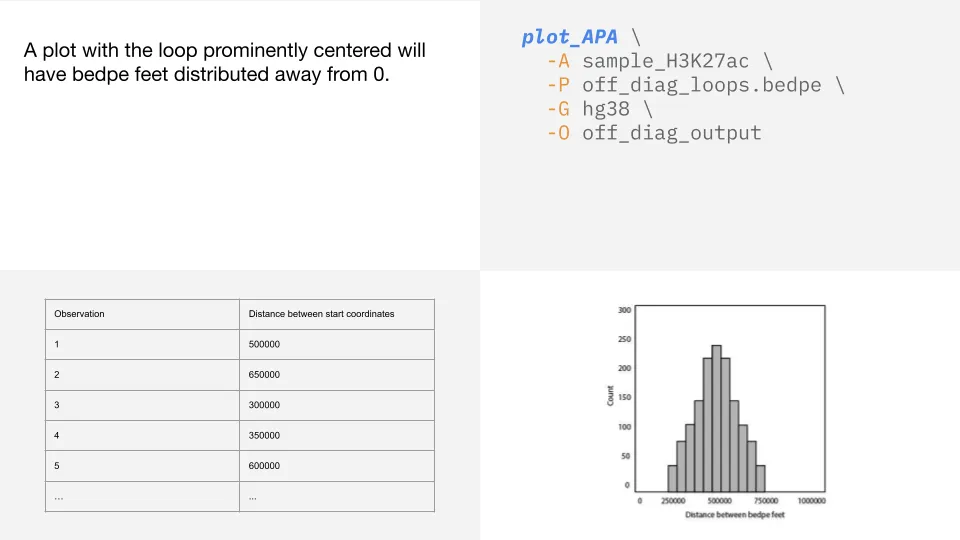
Off-diagonal loops
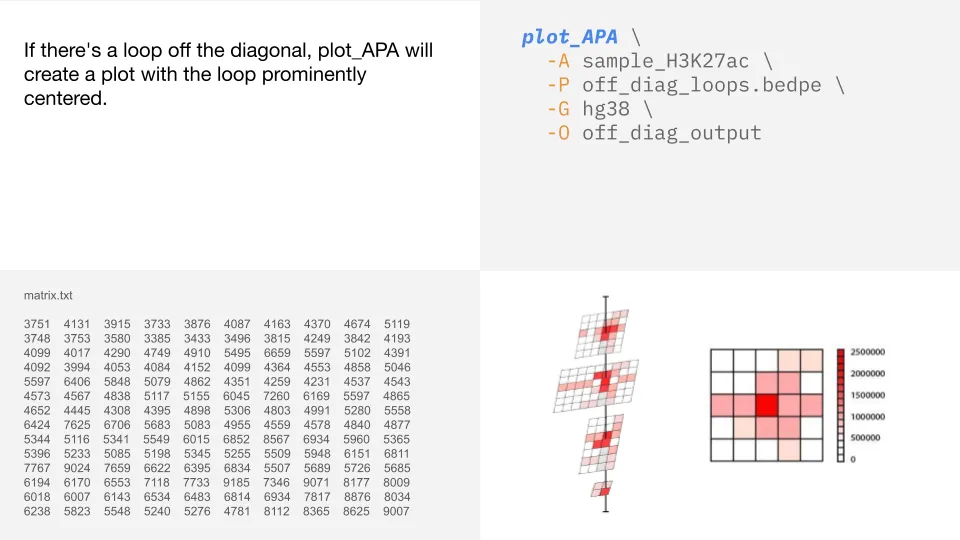
In this example, we analyze one sample with off-diagonal loops specified in a bedpe file, along with the
genome build and output directory name. Since we are not specifying a value with --bin_size, the default
bin size of 5000 will be used.
The APA plot will show a clear loop with a bright red center, indicating the presence of off-diagonal loops.
Normalization
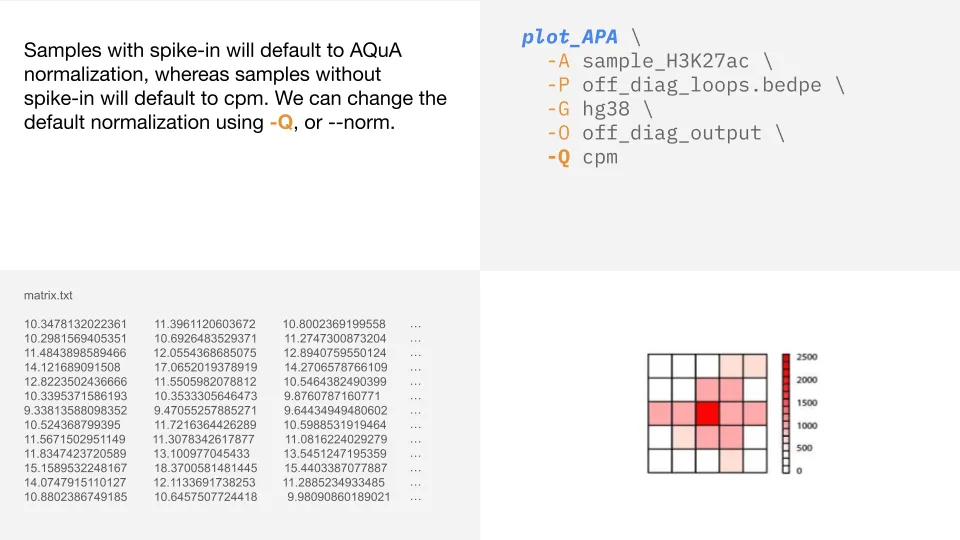
The parameter -Q supports three normalization methods: cpm, aqua, or none. If not specified, non-spike-in
samples will default to cpm and spike-in samples will default to aqua.
Normalization by number of loops
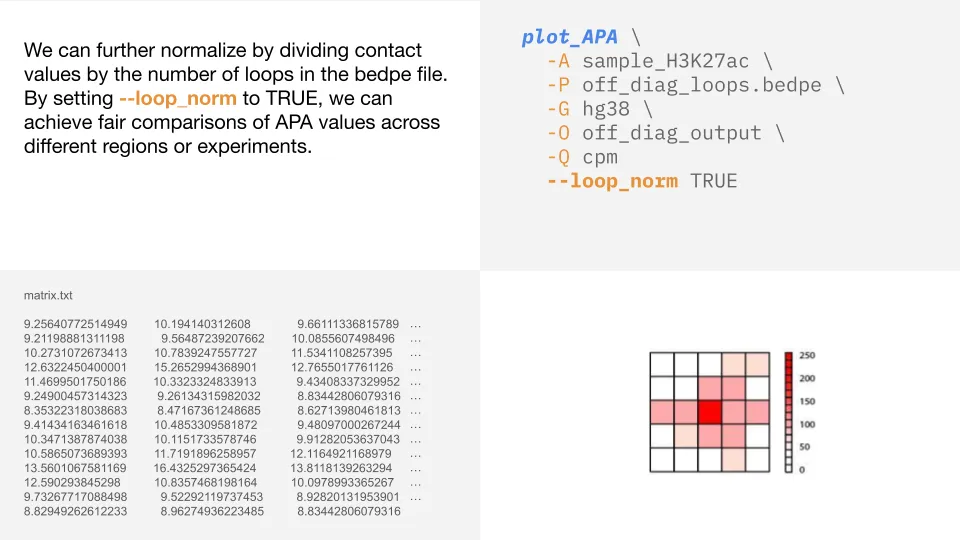
In addition to the normalization methods available with -Q, we can also set loop_norm to TRUE to normalize
by the number of loops (number of rows in the bedpe file). This ensures fair comparisons across analyses
so that samples with more loops don’t show higher signals just because they have more loops.
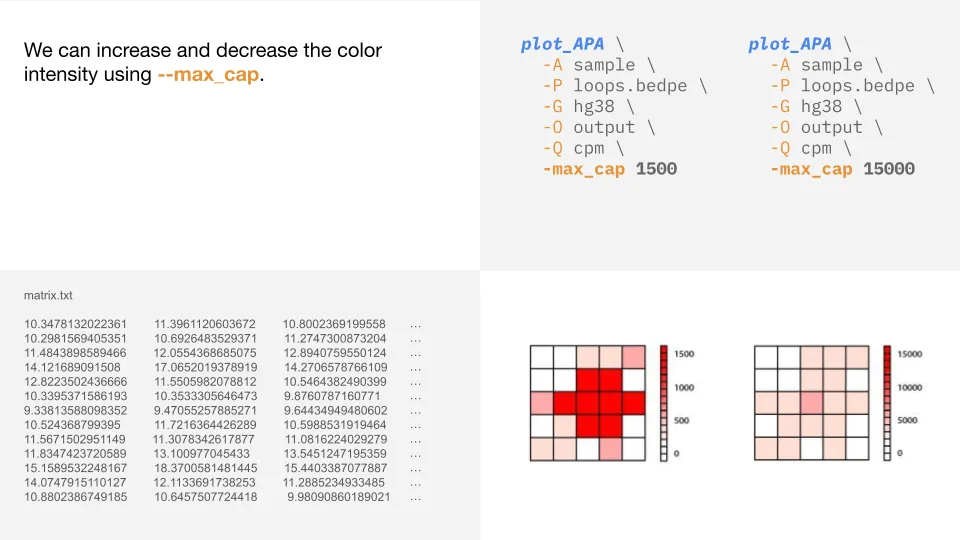
Changing color intensity
Using --max_cap allows for manual control over the color scale. In the plot on the left, we have decreased
the --max_cap, effectively increasing the color intensity. In the plot on the right, we have
increased the --max_cap, decreasing the color intensity.
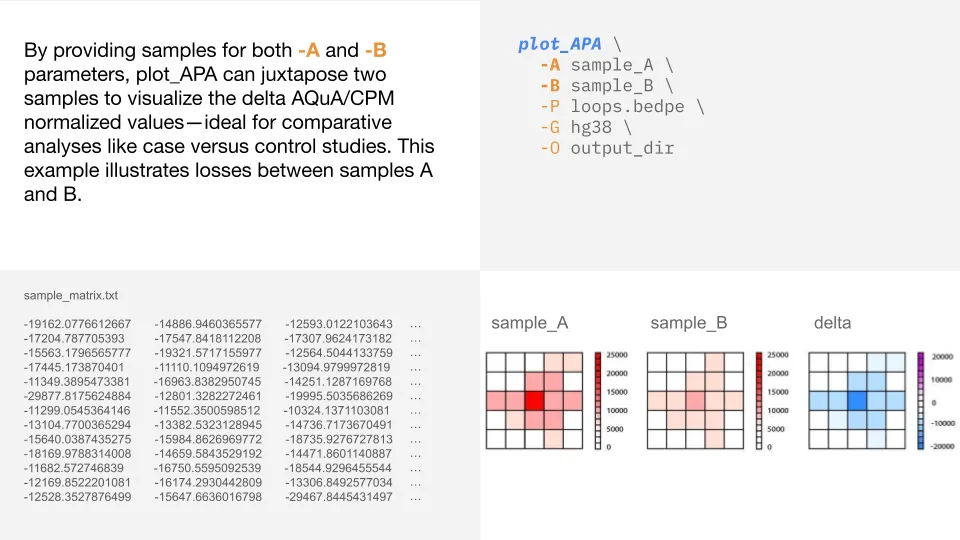
Two-sample delta analyses
If provided two samples (-A and -B), plot_APA will generate three APA plots. The first two
plots correspond to each individual sample and the third plot is a delta plot showing sample B values minus
sample A values. Blue values indicate losses and pink values indicate gains. You can also adjust the color scale
for delta plots by setting --max_cap_delta.
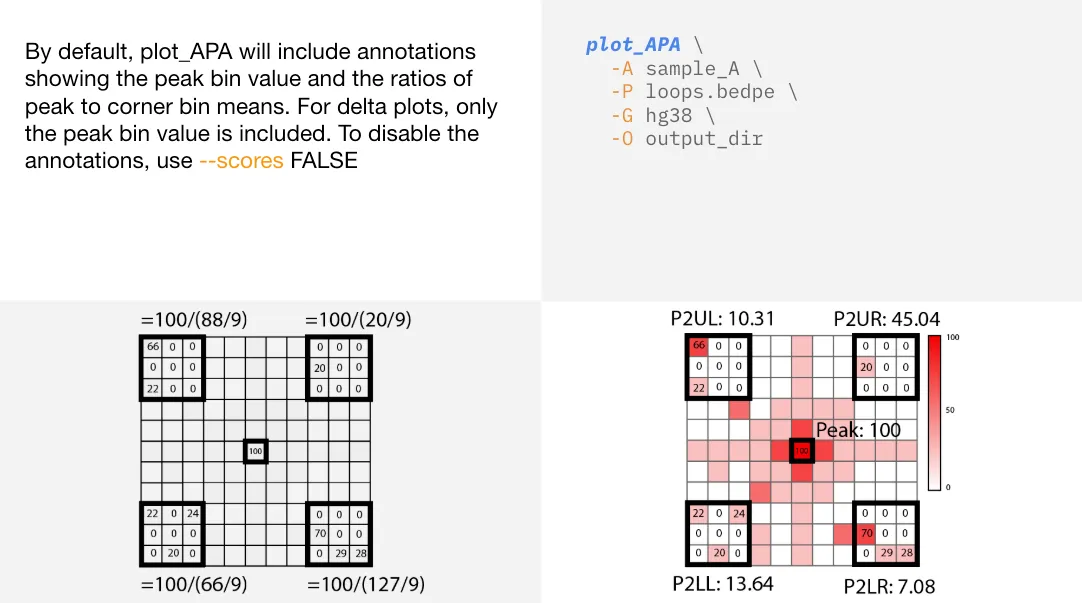
APA scores
APA scores are annotated on plot_APA plots by default. Annotations included are: peak bin value, P2LL (peak to lower left),
P2UL (peak to upper left), P2UR (peak to upper right), and P2LR (peak to lower right).
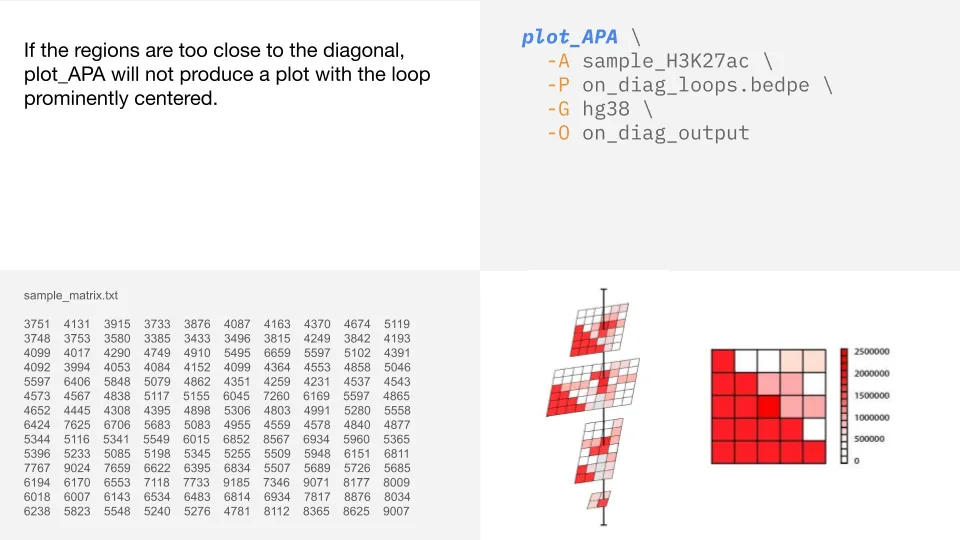
On-diagonal loops
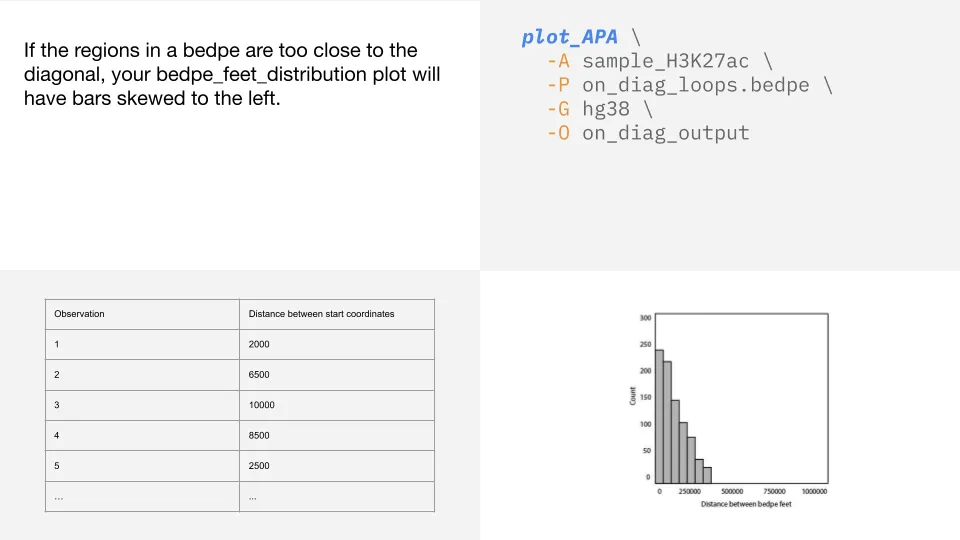
When regions are close to the diagonal, it means they are very near each other in the linear sequence.
These interactions create noise along the diagonal and do not result in a clear loop in the APA plot.
Below is an example of a loop that is too near the diagonal to visualize with plot_APA.
Bedpe feet distance histograms
plot_APA generates histograms for each analysis that show the distance of pairs from the diagonal.
This can be helpful to check if you end up with a plot that does not show a clear loop.
Usage
plot_APA generates APA (Aggregate Peak Analysis) plots using raw or normalized contact values from genomic pair data.
Usage and Option Summary
plot_APA \ -P /path/to/example_pairs.bedpe \ -A sample_H3K27ac \ -G hg38 \ -O /path/to/output_directory(or):
plot_APA \ -P /path/to/example_pairs.bedpe \ -A sample_H3K27ac \ -B sample_H3K27me3 \ -G hg38 \ -O /path/to/output_directory \ --resolution 10000 \ --max_cap 50 \ --max_cap_delta 100Required
| Short Option | Long Option | Description |
|---|---|---|
-P | --bedpe | Path to the bedpe (pairs) file you want to use, without headers |
-A | --sample1 | Name of the sample as it appears on the Tinkerbox |
-G | --genome | Genome build used for sample processing. Strictly hg19, hg38, or mm10. |
Optional
| Short Option | Long Option | Description |
|---|---|---|
-O | --out-dir | Name of the directory to store the output APA plot in |
-B | --sample2 | For two sample delta plots, name of the second sample |
-Q | --norm | Which normalization to use. Strictly ‘cpm’, ‘aqua’, or ‘none’ in lower case. Non-spike-in samples default to cpm. Spike-in samples default to aqua |
--loop_norm | If TRUE, normalizes APA values by loop count in bedpe. Default FALSE | |
--resolution | Bin size you want to use for the APA plots. Default = 5000 | |
--max_cap | Upper limit of the plot range. Defaults to max bin value | |
--min_cap | Lower limit of the plot range. Default 0 | |
--max_cap_delta | Upper limit of delta plot range. Defaults to max bin value. For two-sample analyses only | |
--loop_norm | If TRUE, APA values are normalized by the number of loops in the bedpe file. Default FALSE | |
--scores | If TRUE, plots peak bin bin value and ratios of peak:corner means. Default TRUE | |
-h | --help | Help message |