plot_contacts
Concepts
plot_contacts often rounds out the pipeline as the last tool to be used. The visualizations it offers can be likened to hypothesis tests; they not only depict the adjustments made by preceding tools, but can also illuminate areas that may require further modification. This allows researchers to both fine-tune their approaches and generate publication-ready figures.
Vanilla plot
We’ll start this concept tutorial by looking at the simplest way to use plot_contacts with only 3 required parameters.
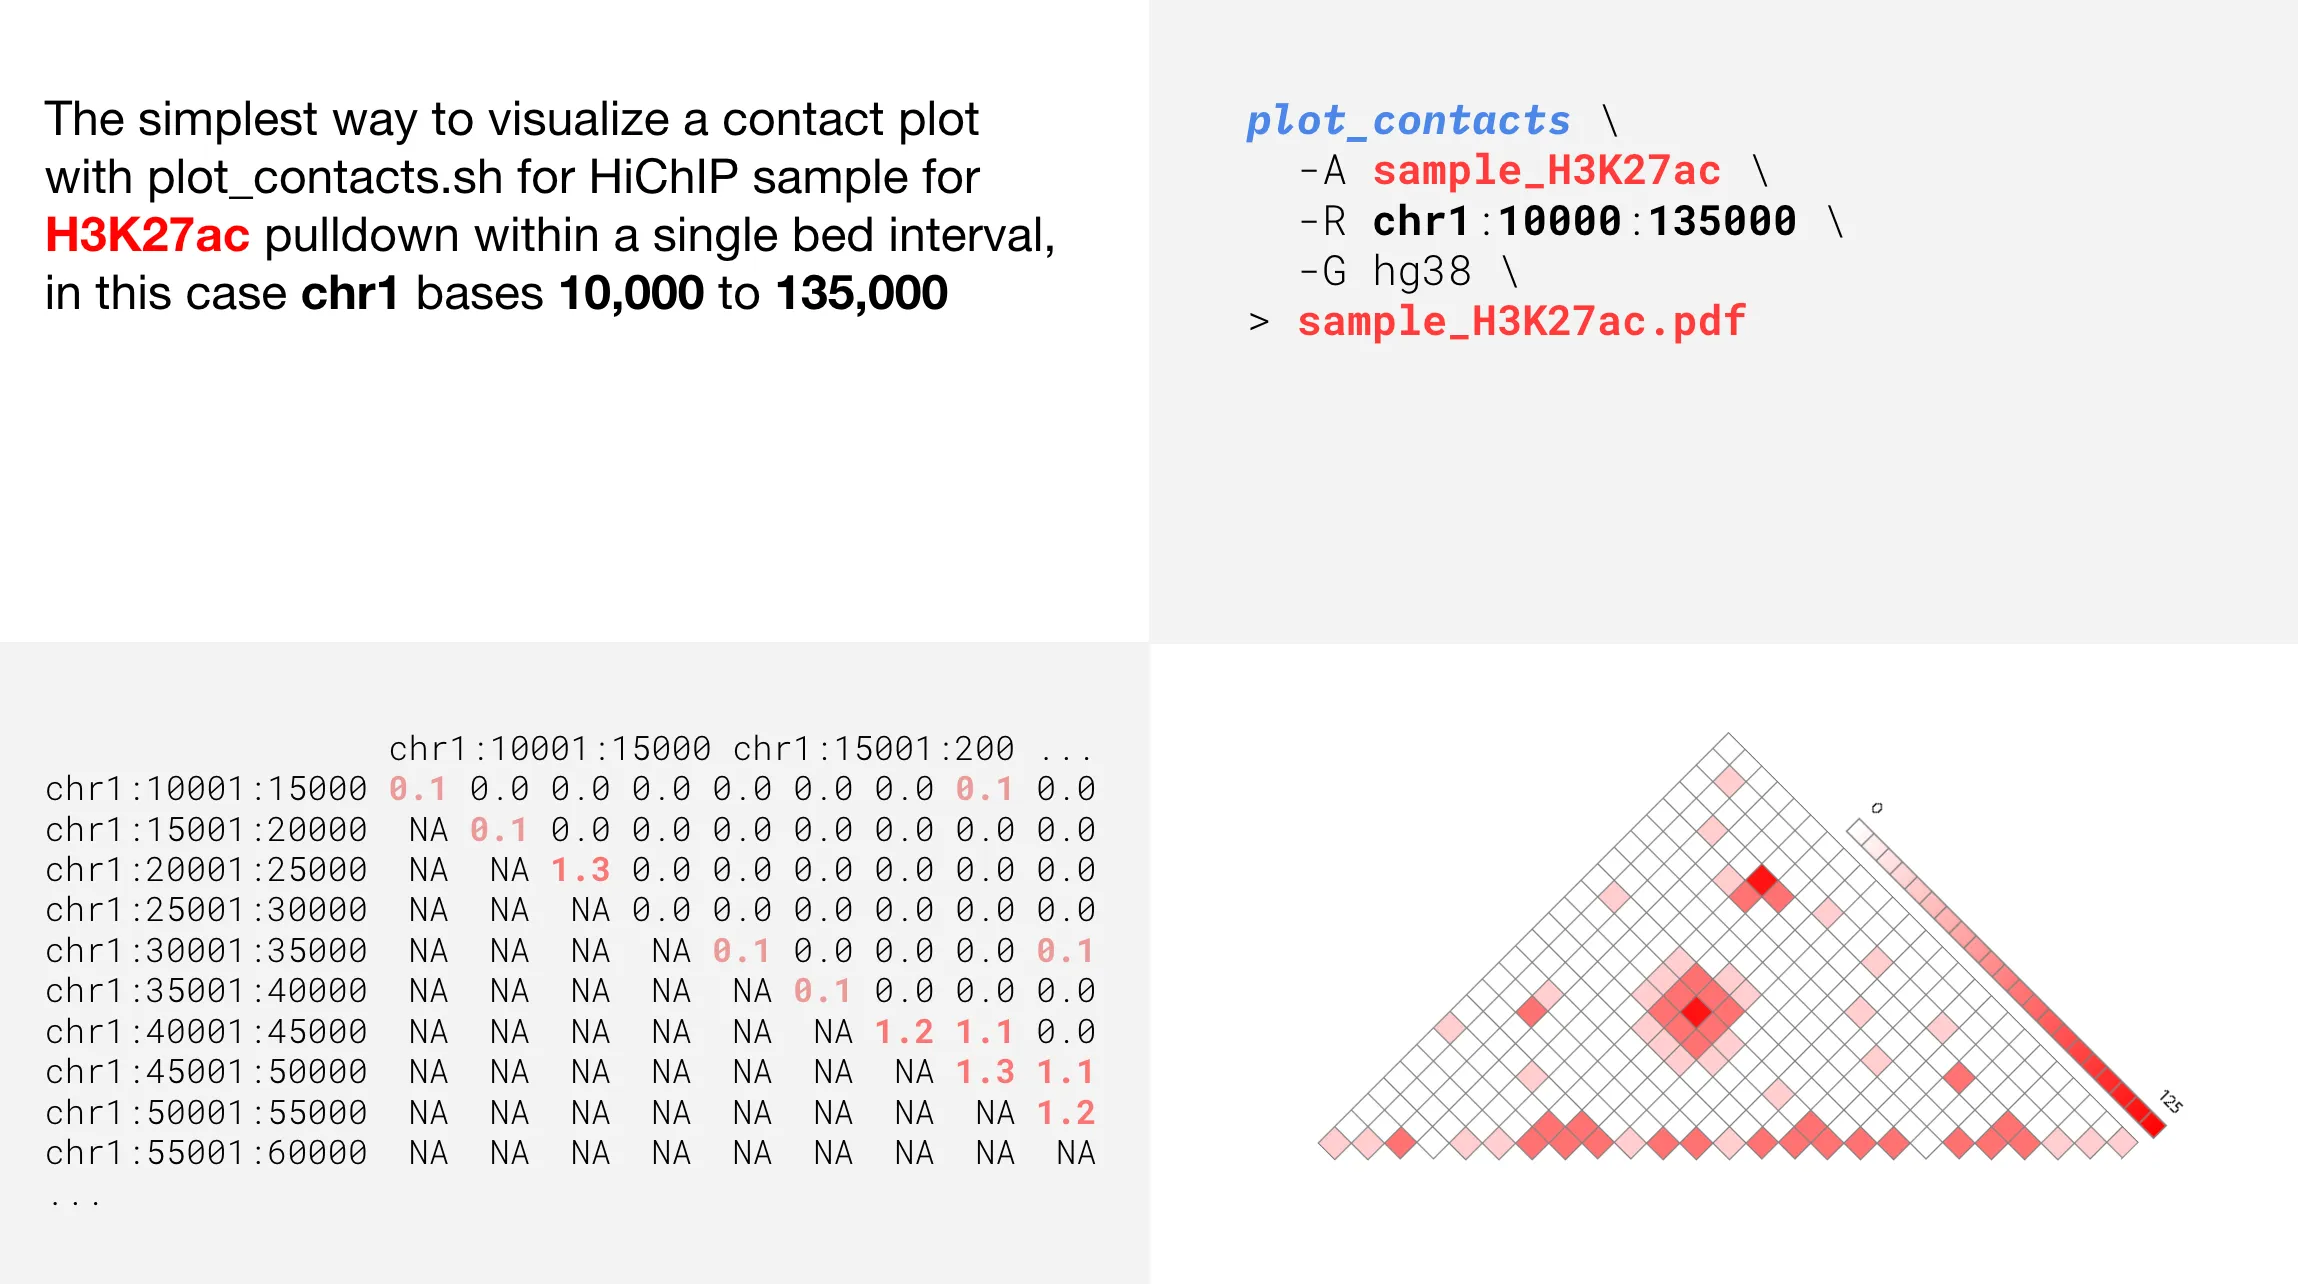
As you can see, the plot is a graphical representation of the upper triangle of a contact matrix. Upon successful completion, the plot will automatically be exported to the ~/shared-files folder for downloading.
Click here to learn more about the capabilities of the shared-files folder.
Changing the resolution
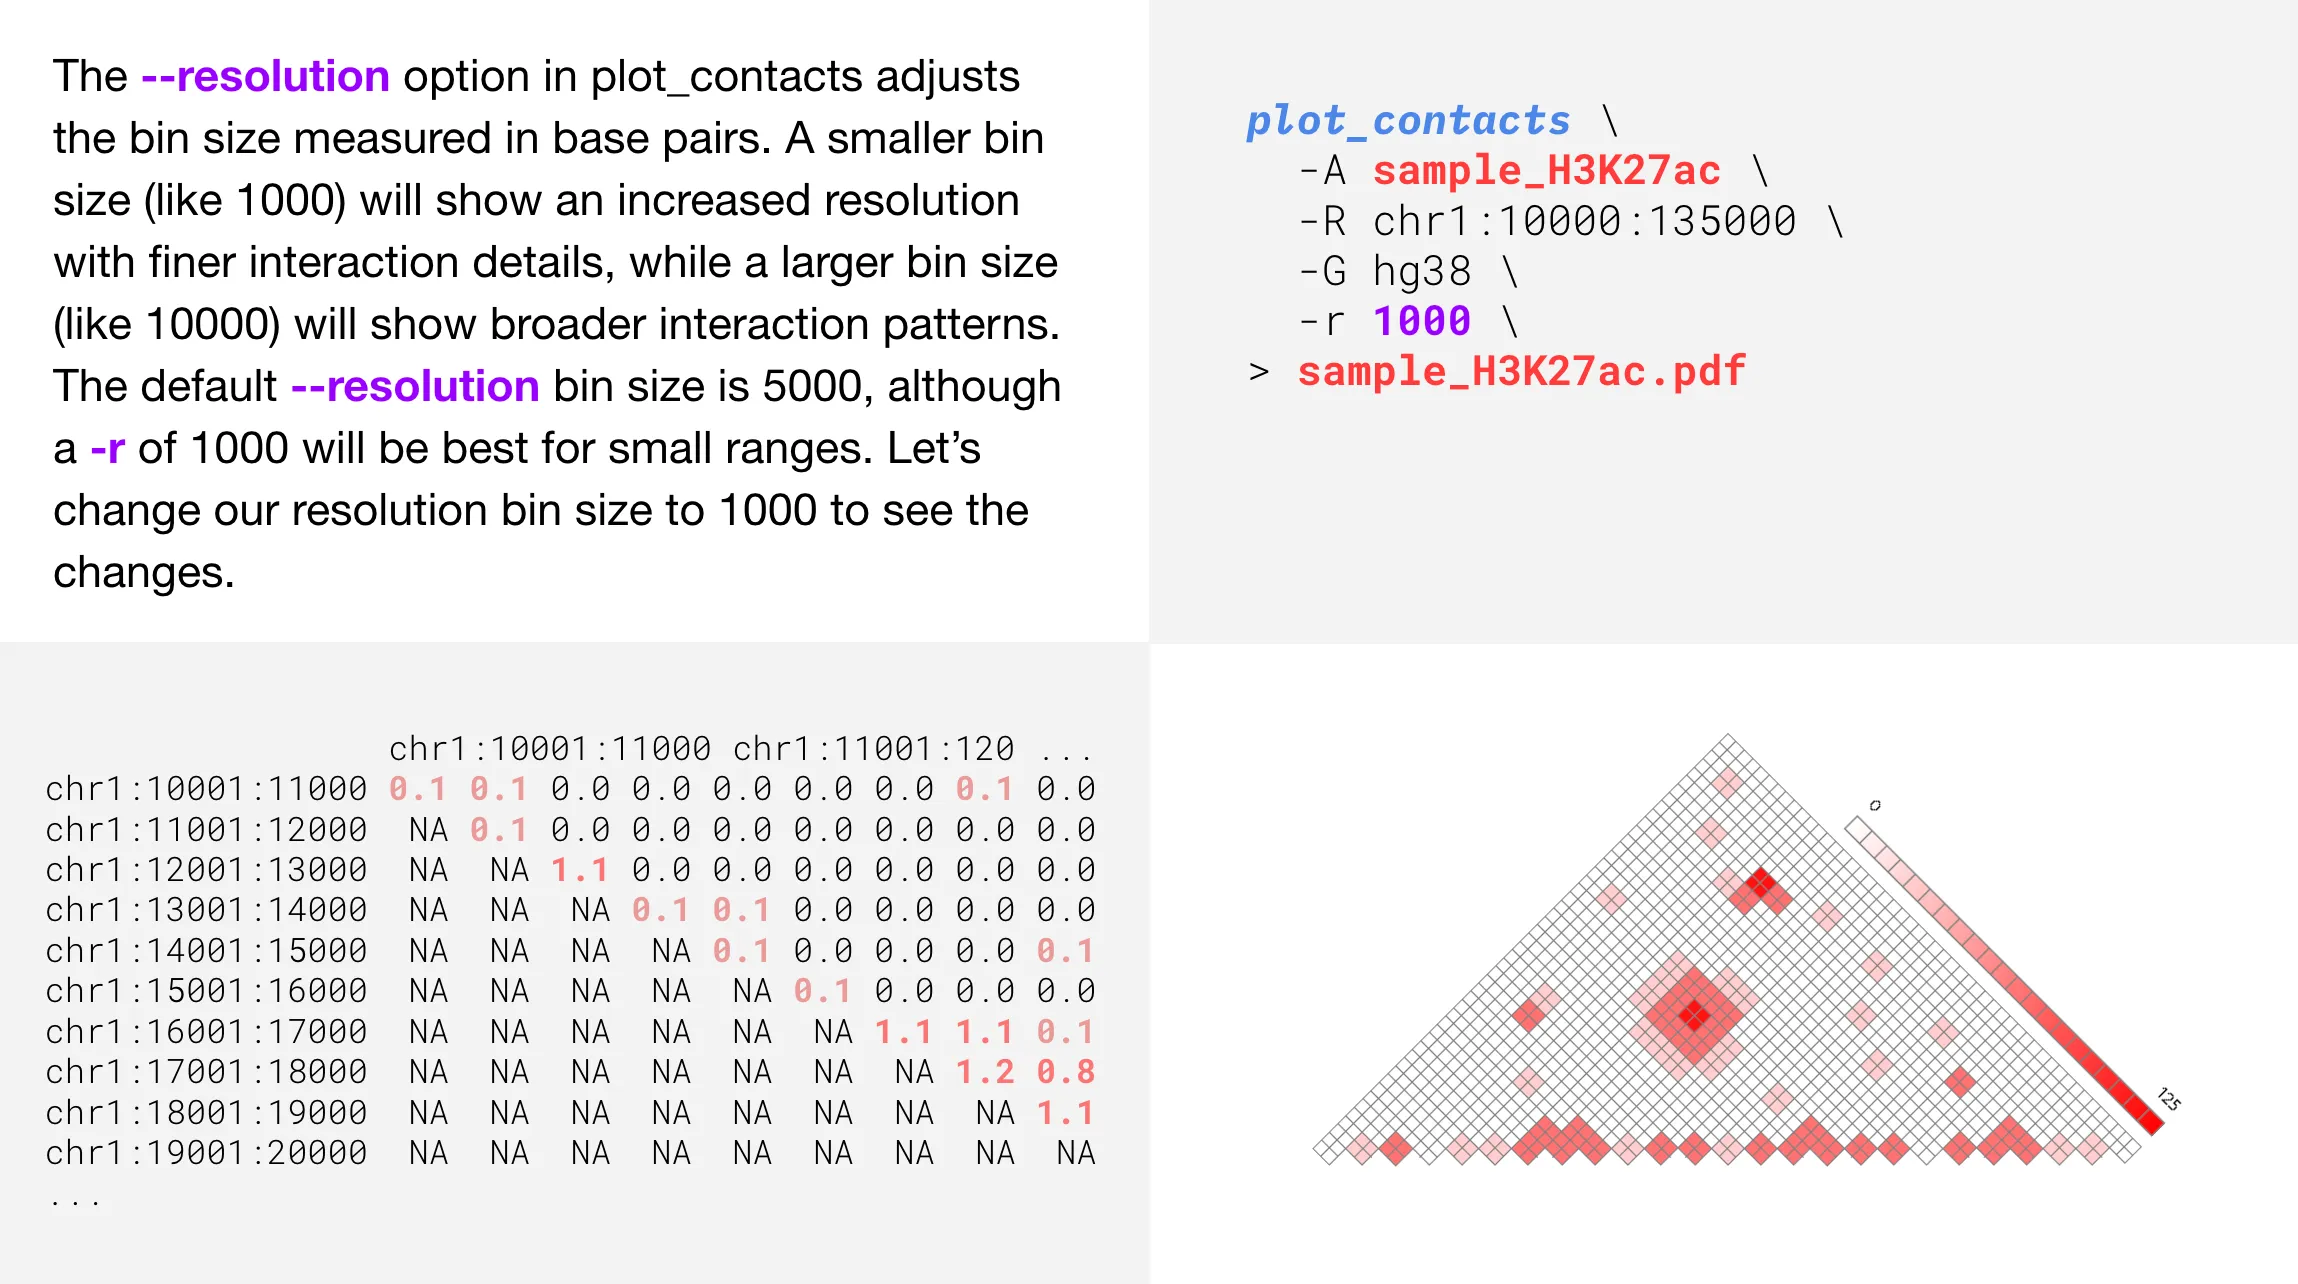
Perhaps a bit counter-intuitive at first, decreasing the --resolution parameter will provide a finer, more granular plot. This is because the numeric value for --resolution refers to the number of base pairs per bin. Therefore, a bin with only 1000 base pairs will be a more detailed visualization compared to a bin with 5000 base pairs.
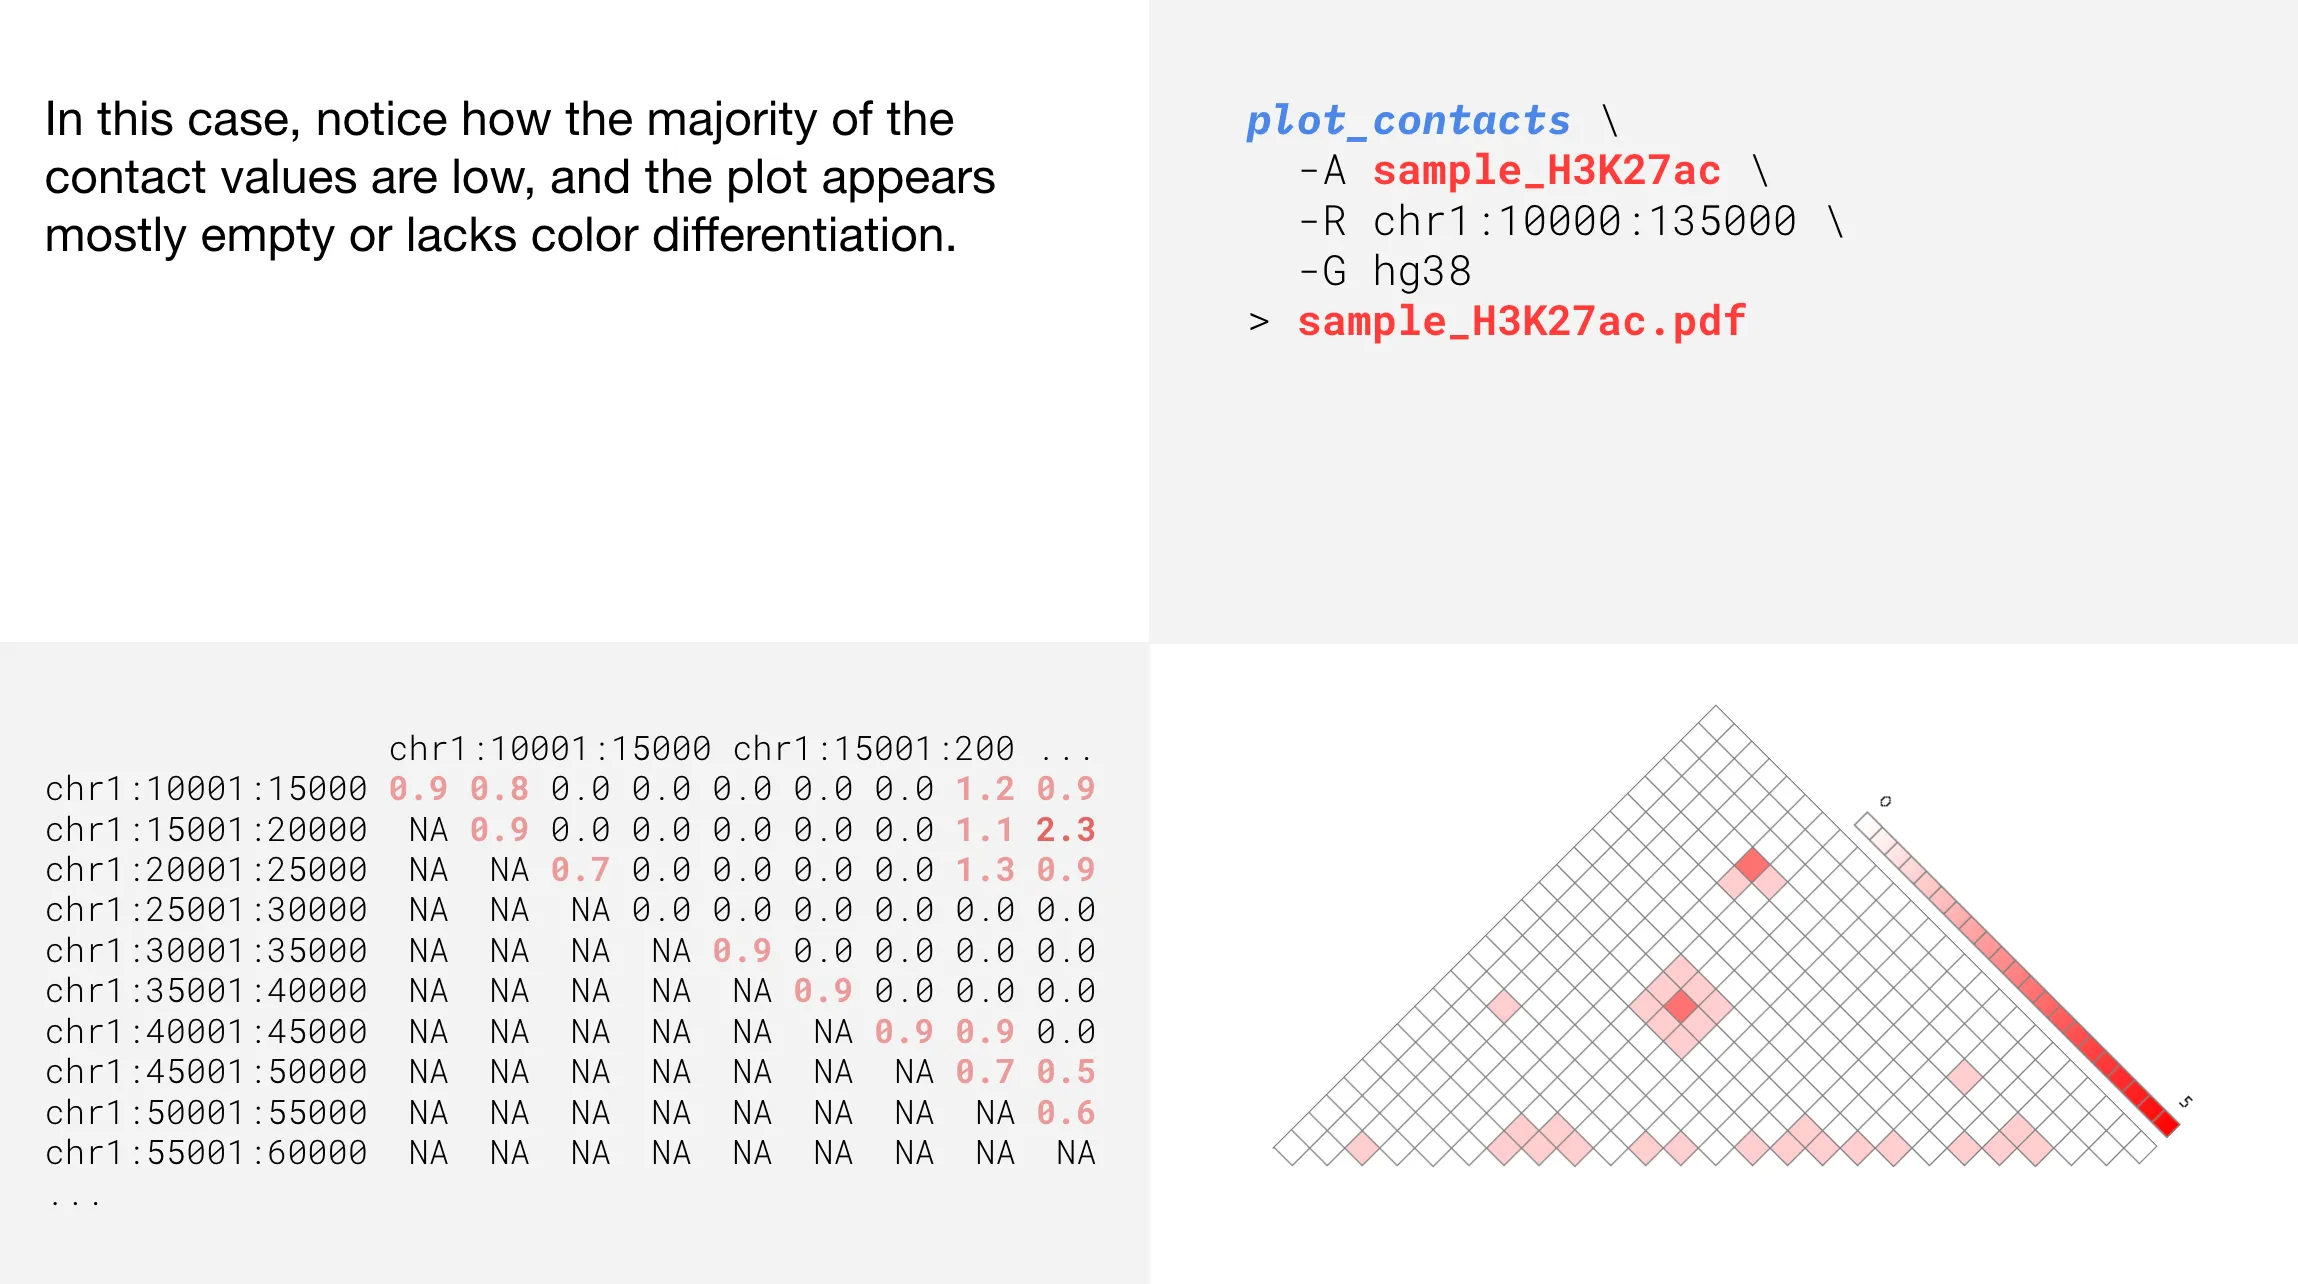
Changing color intensity
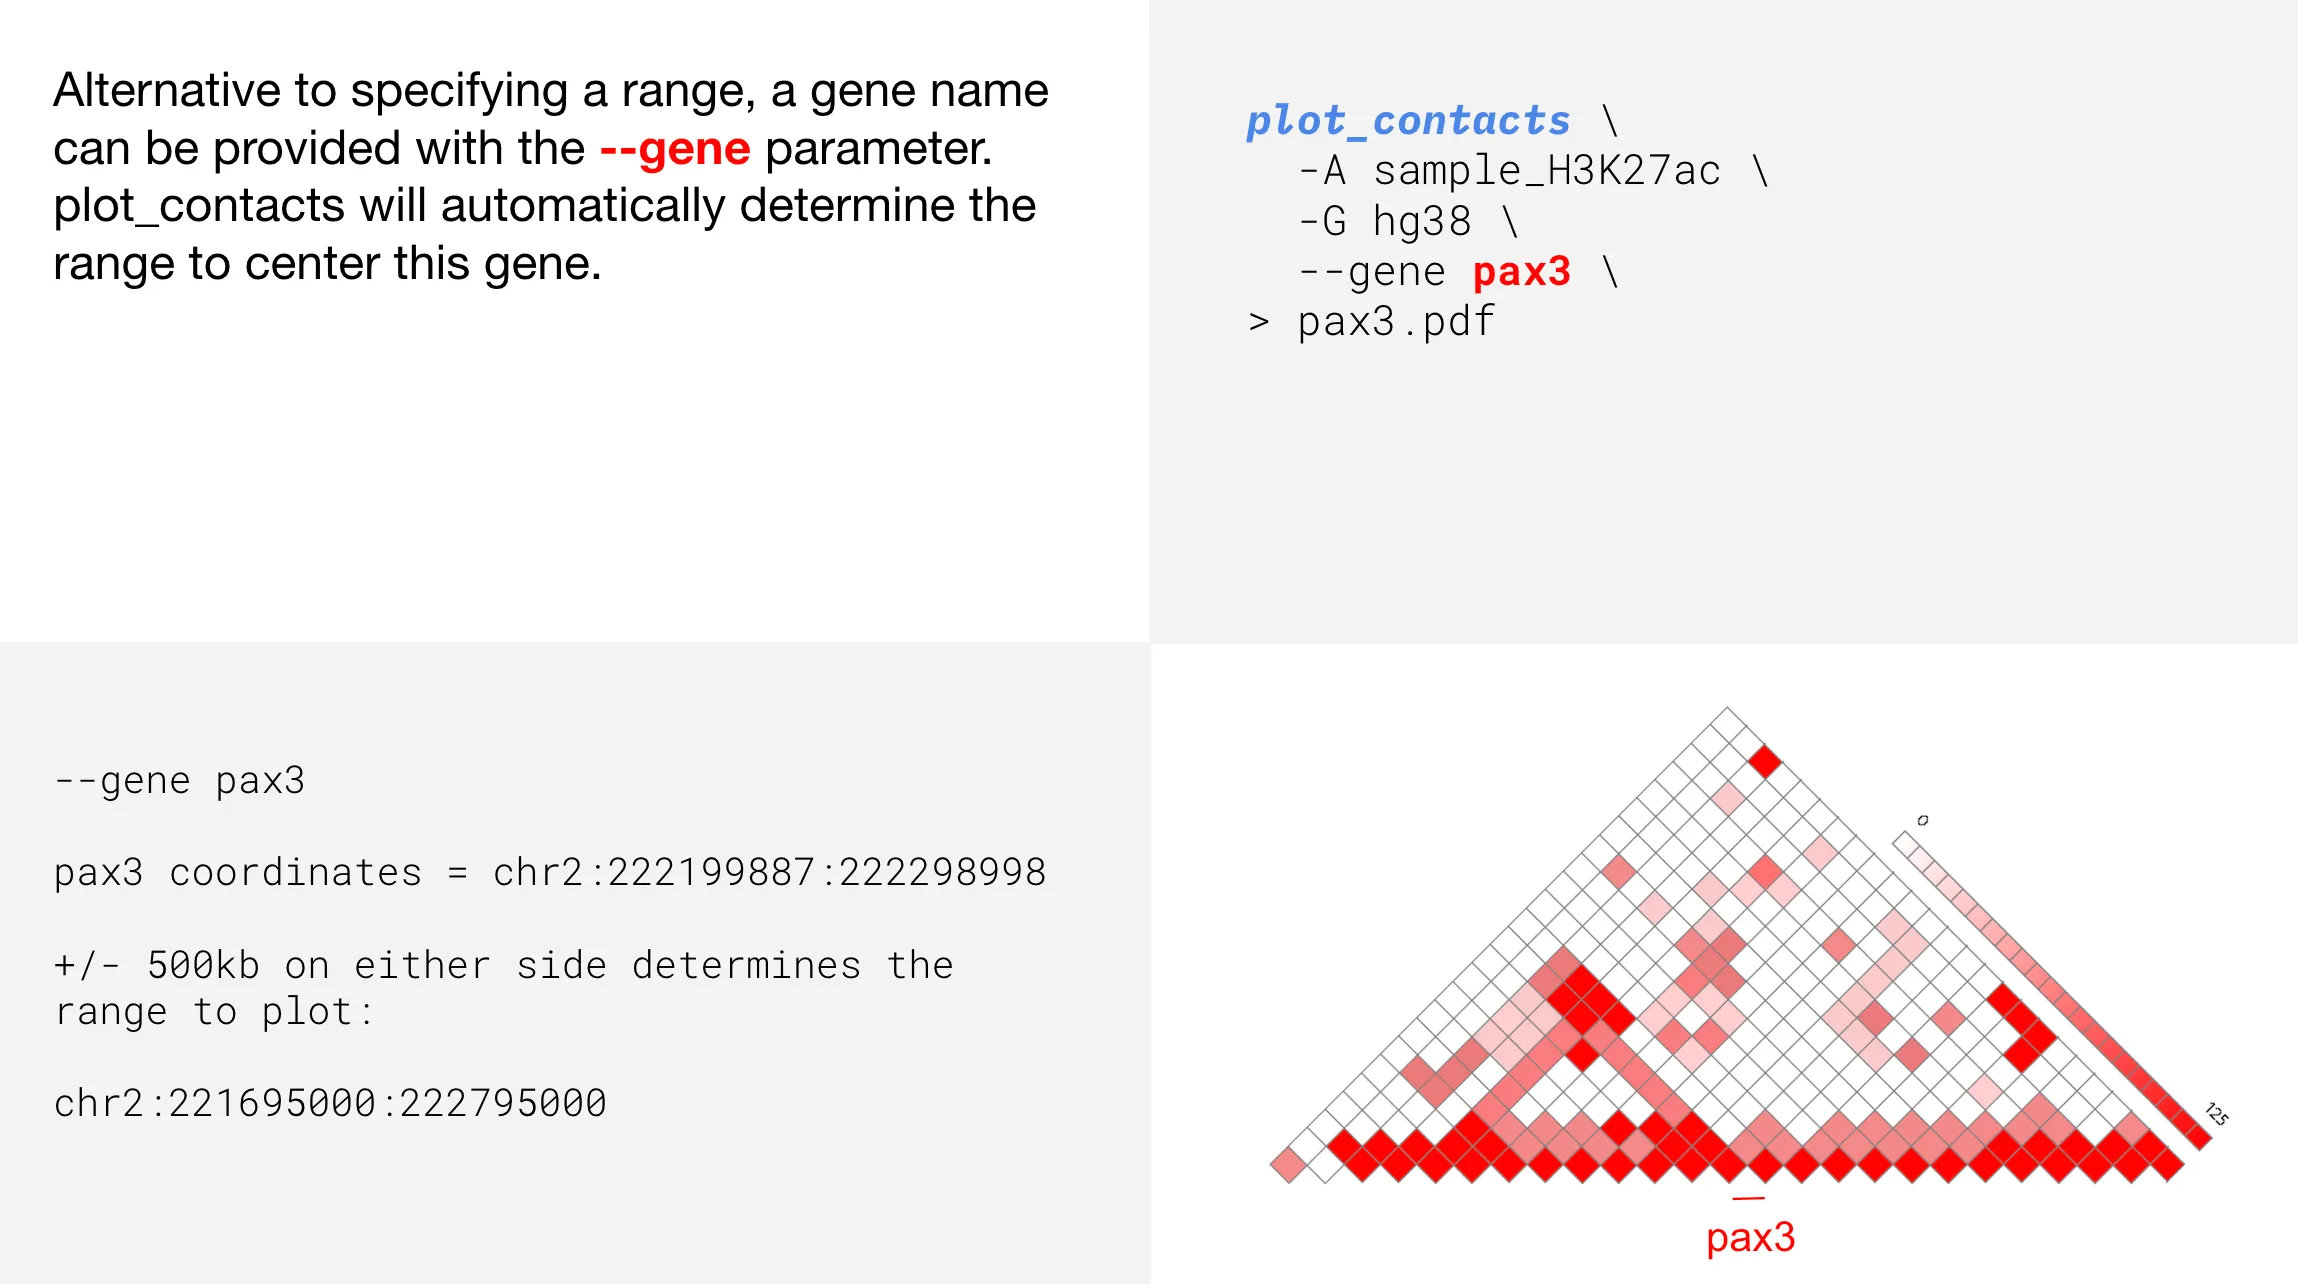
Informing the range with a gene name
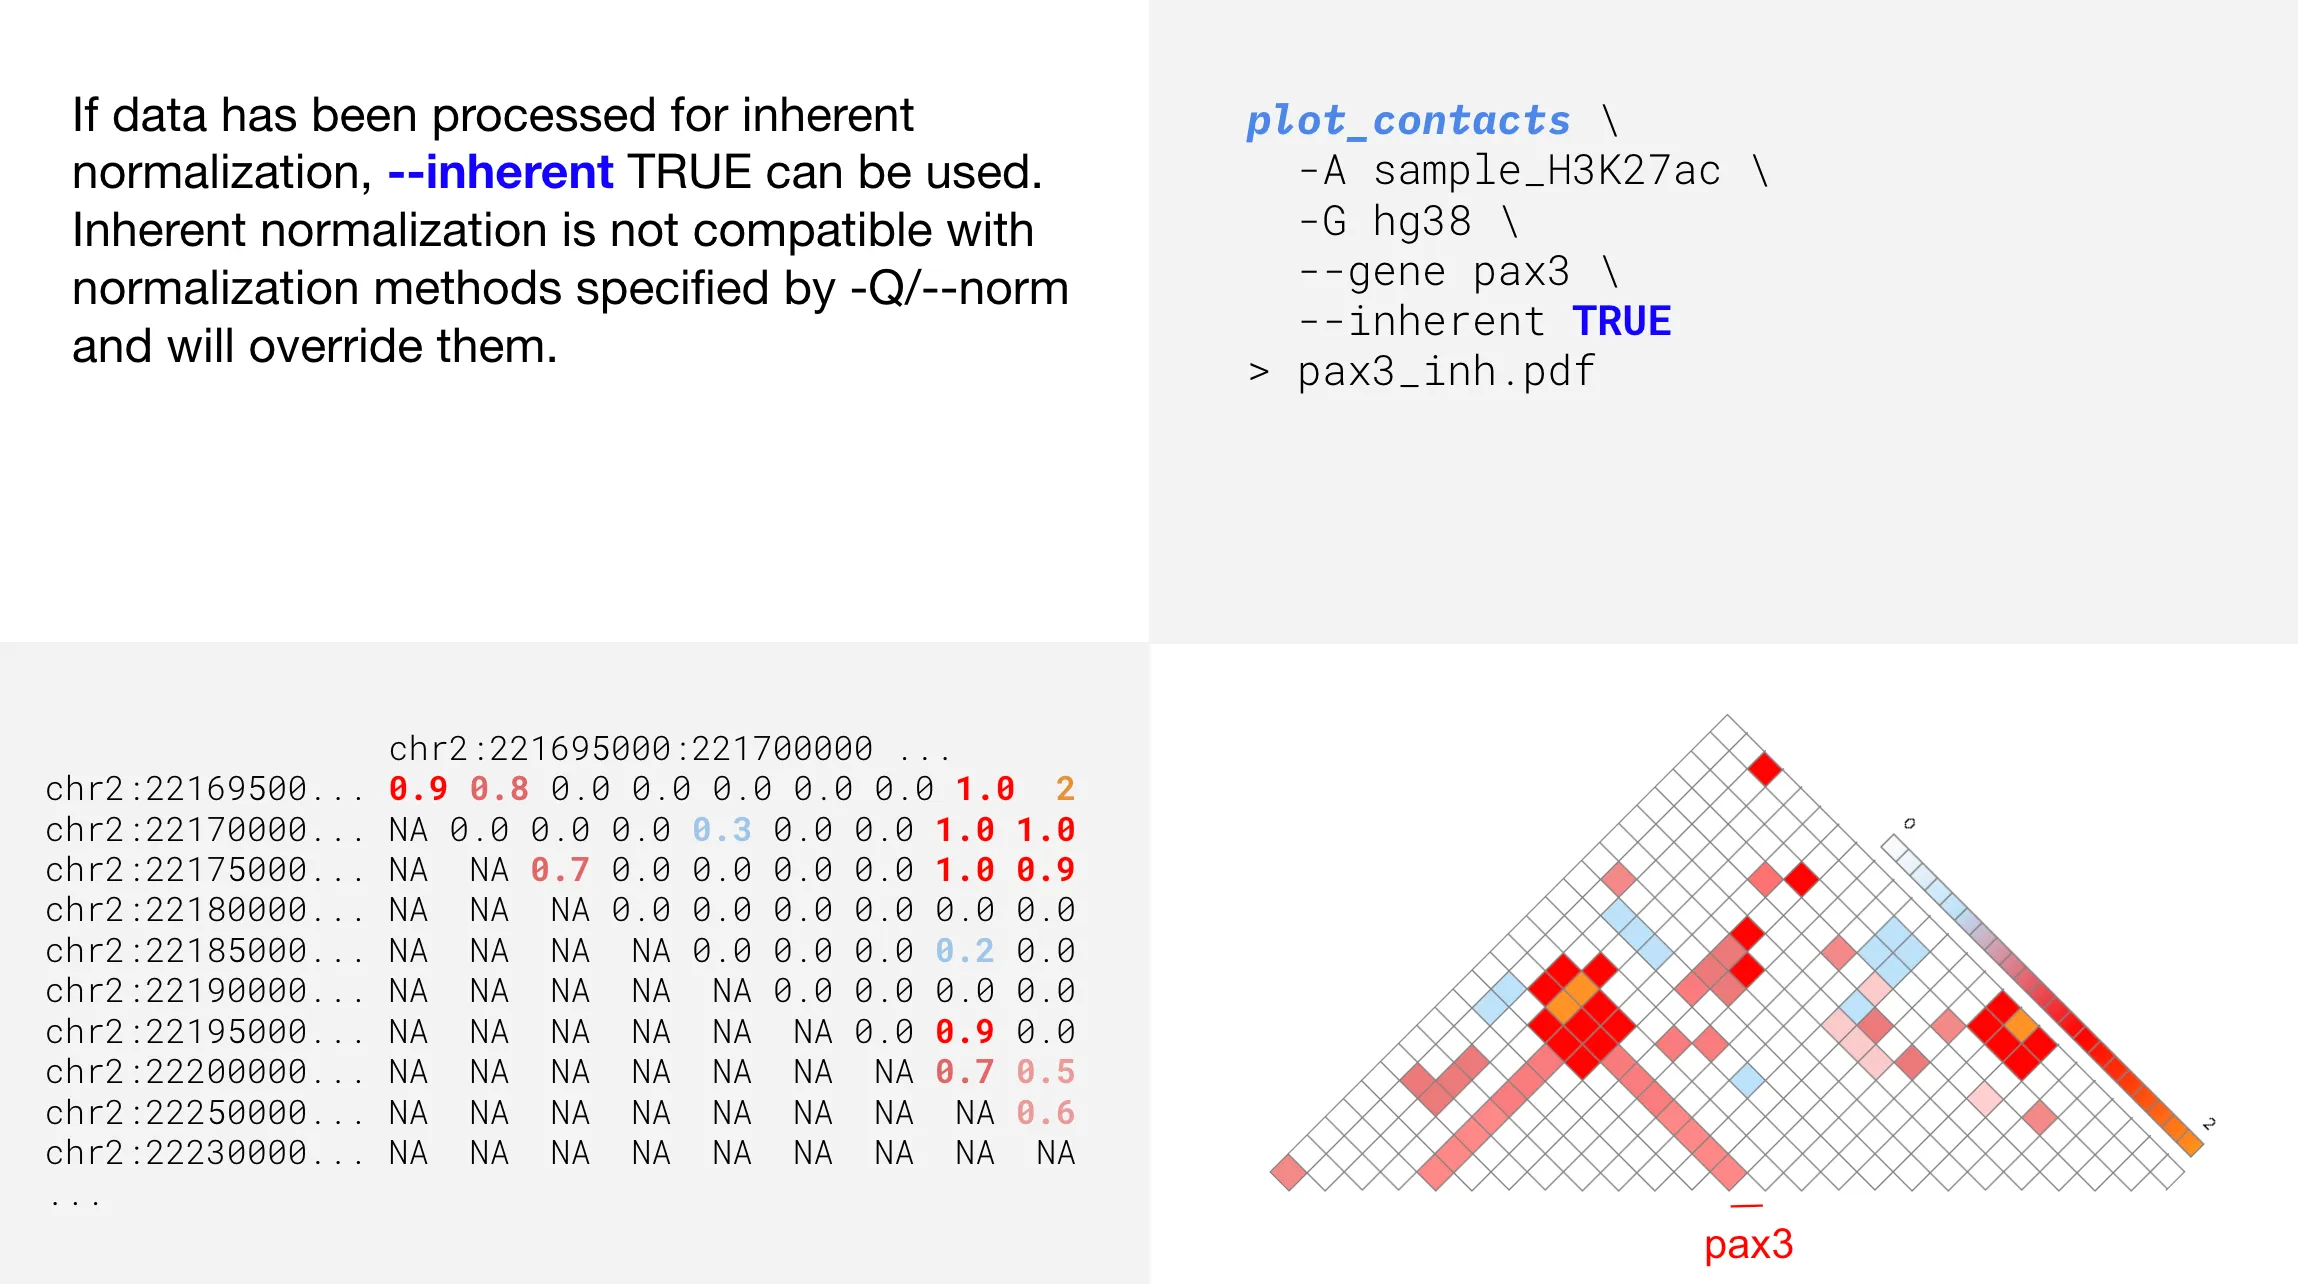
Inherent normalization
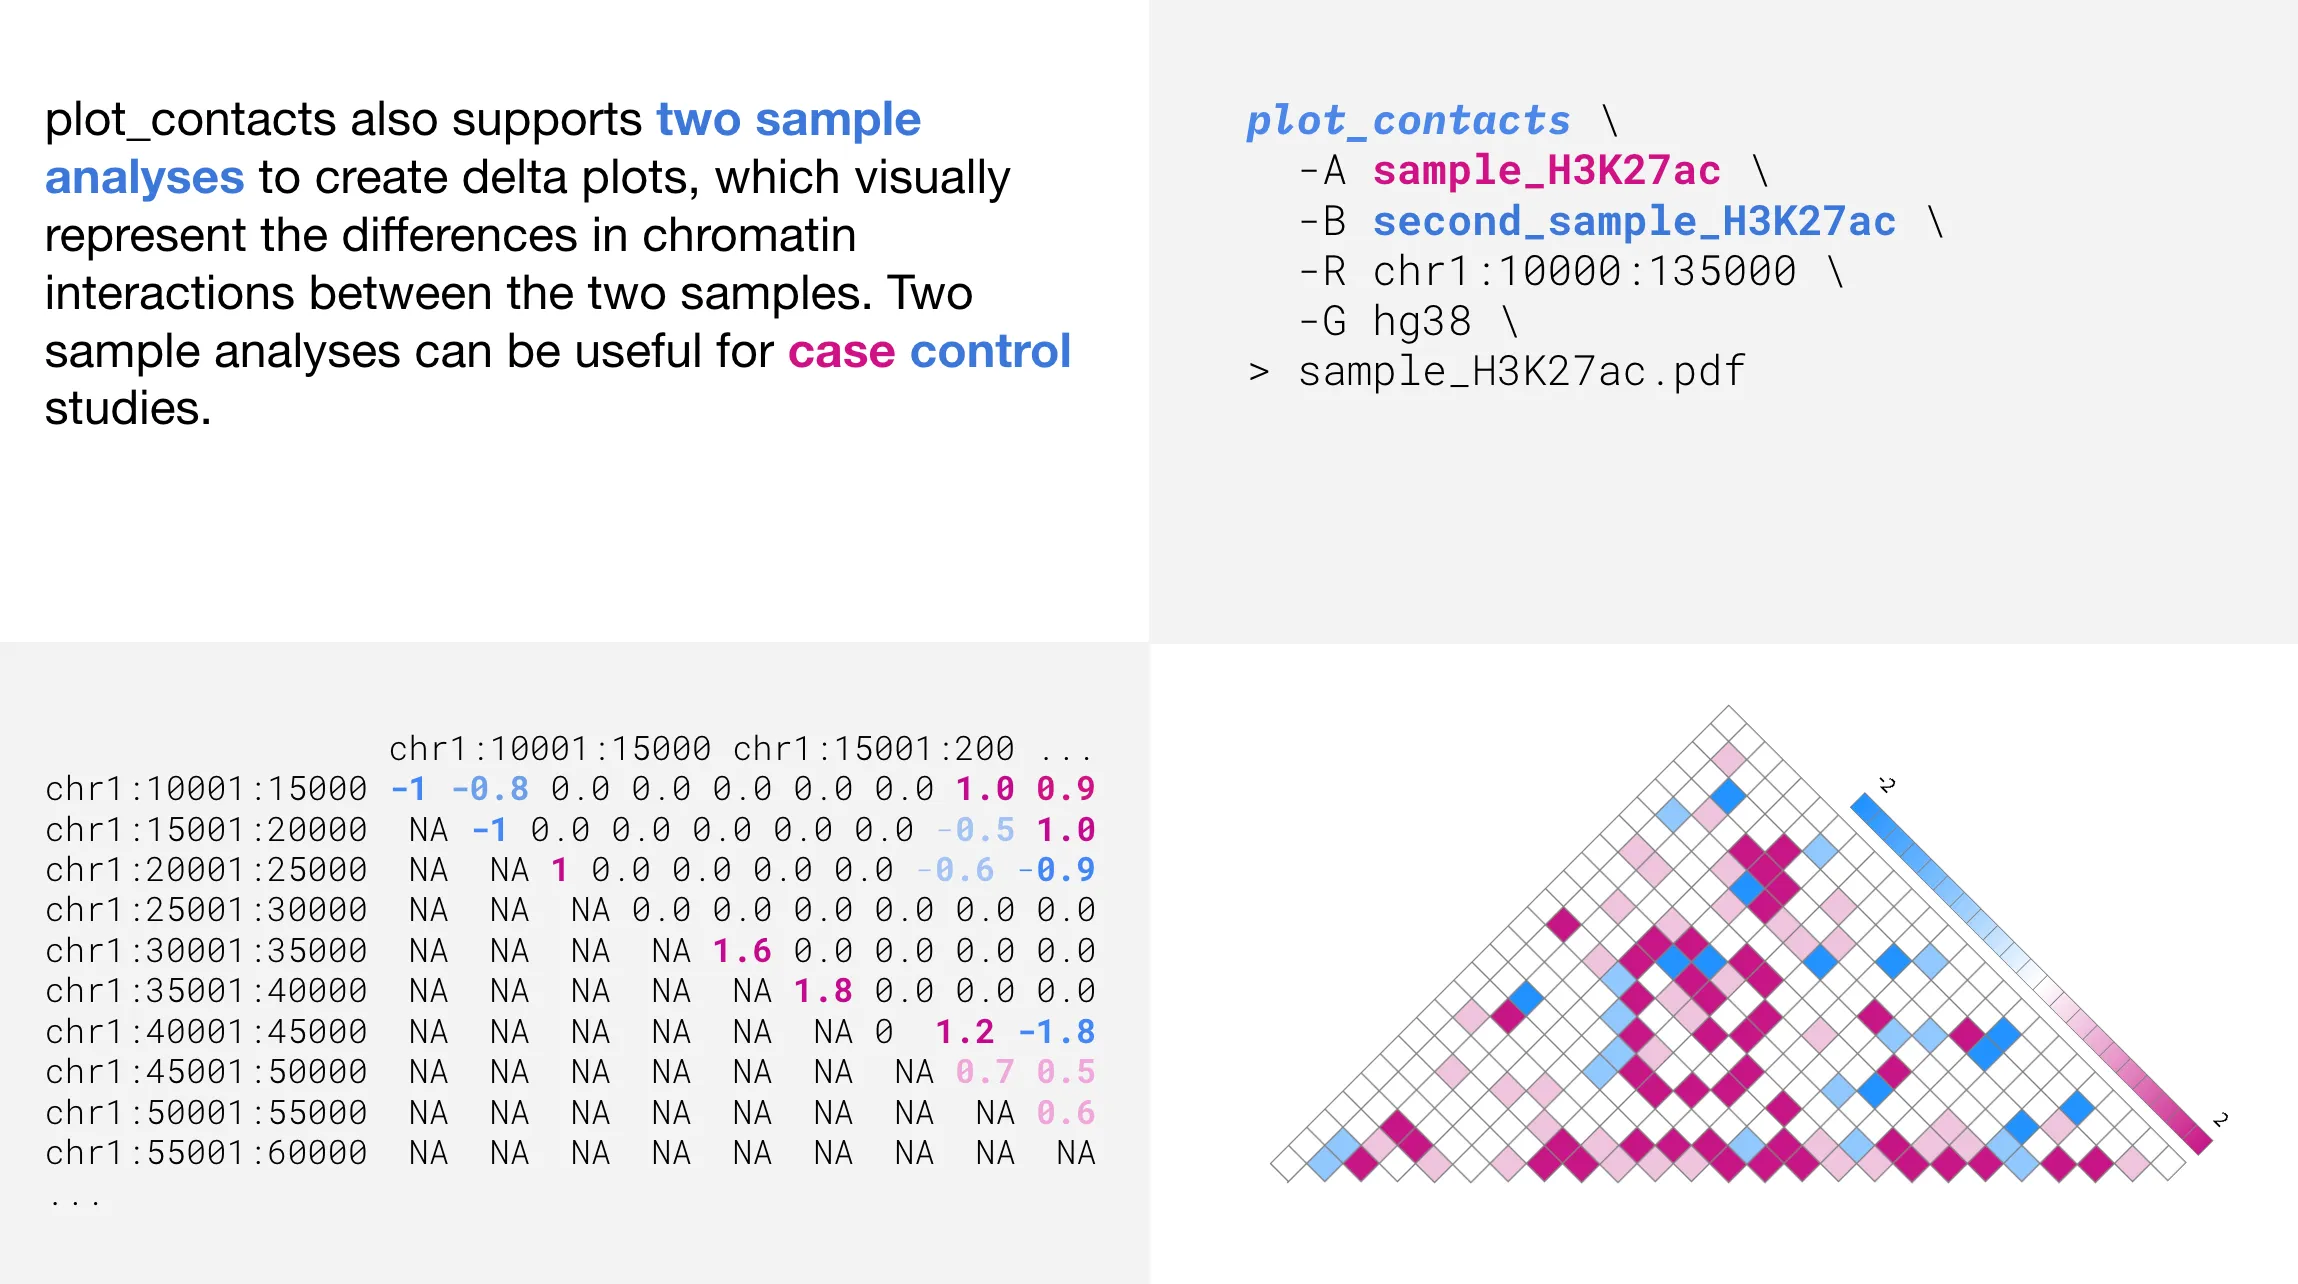
Two sample analyses
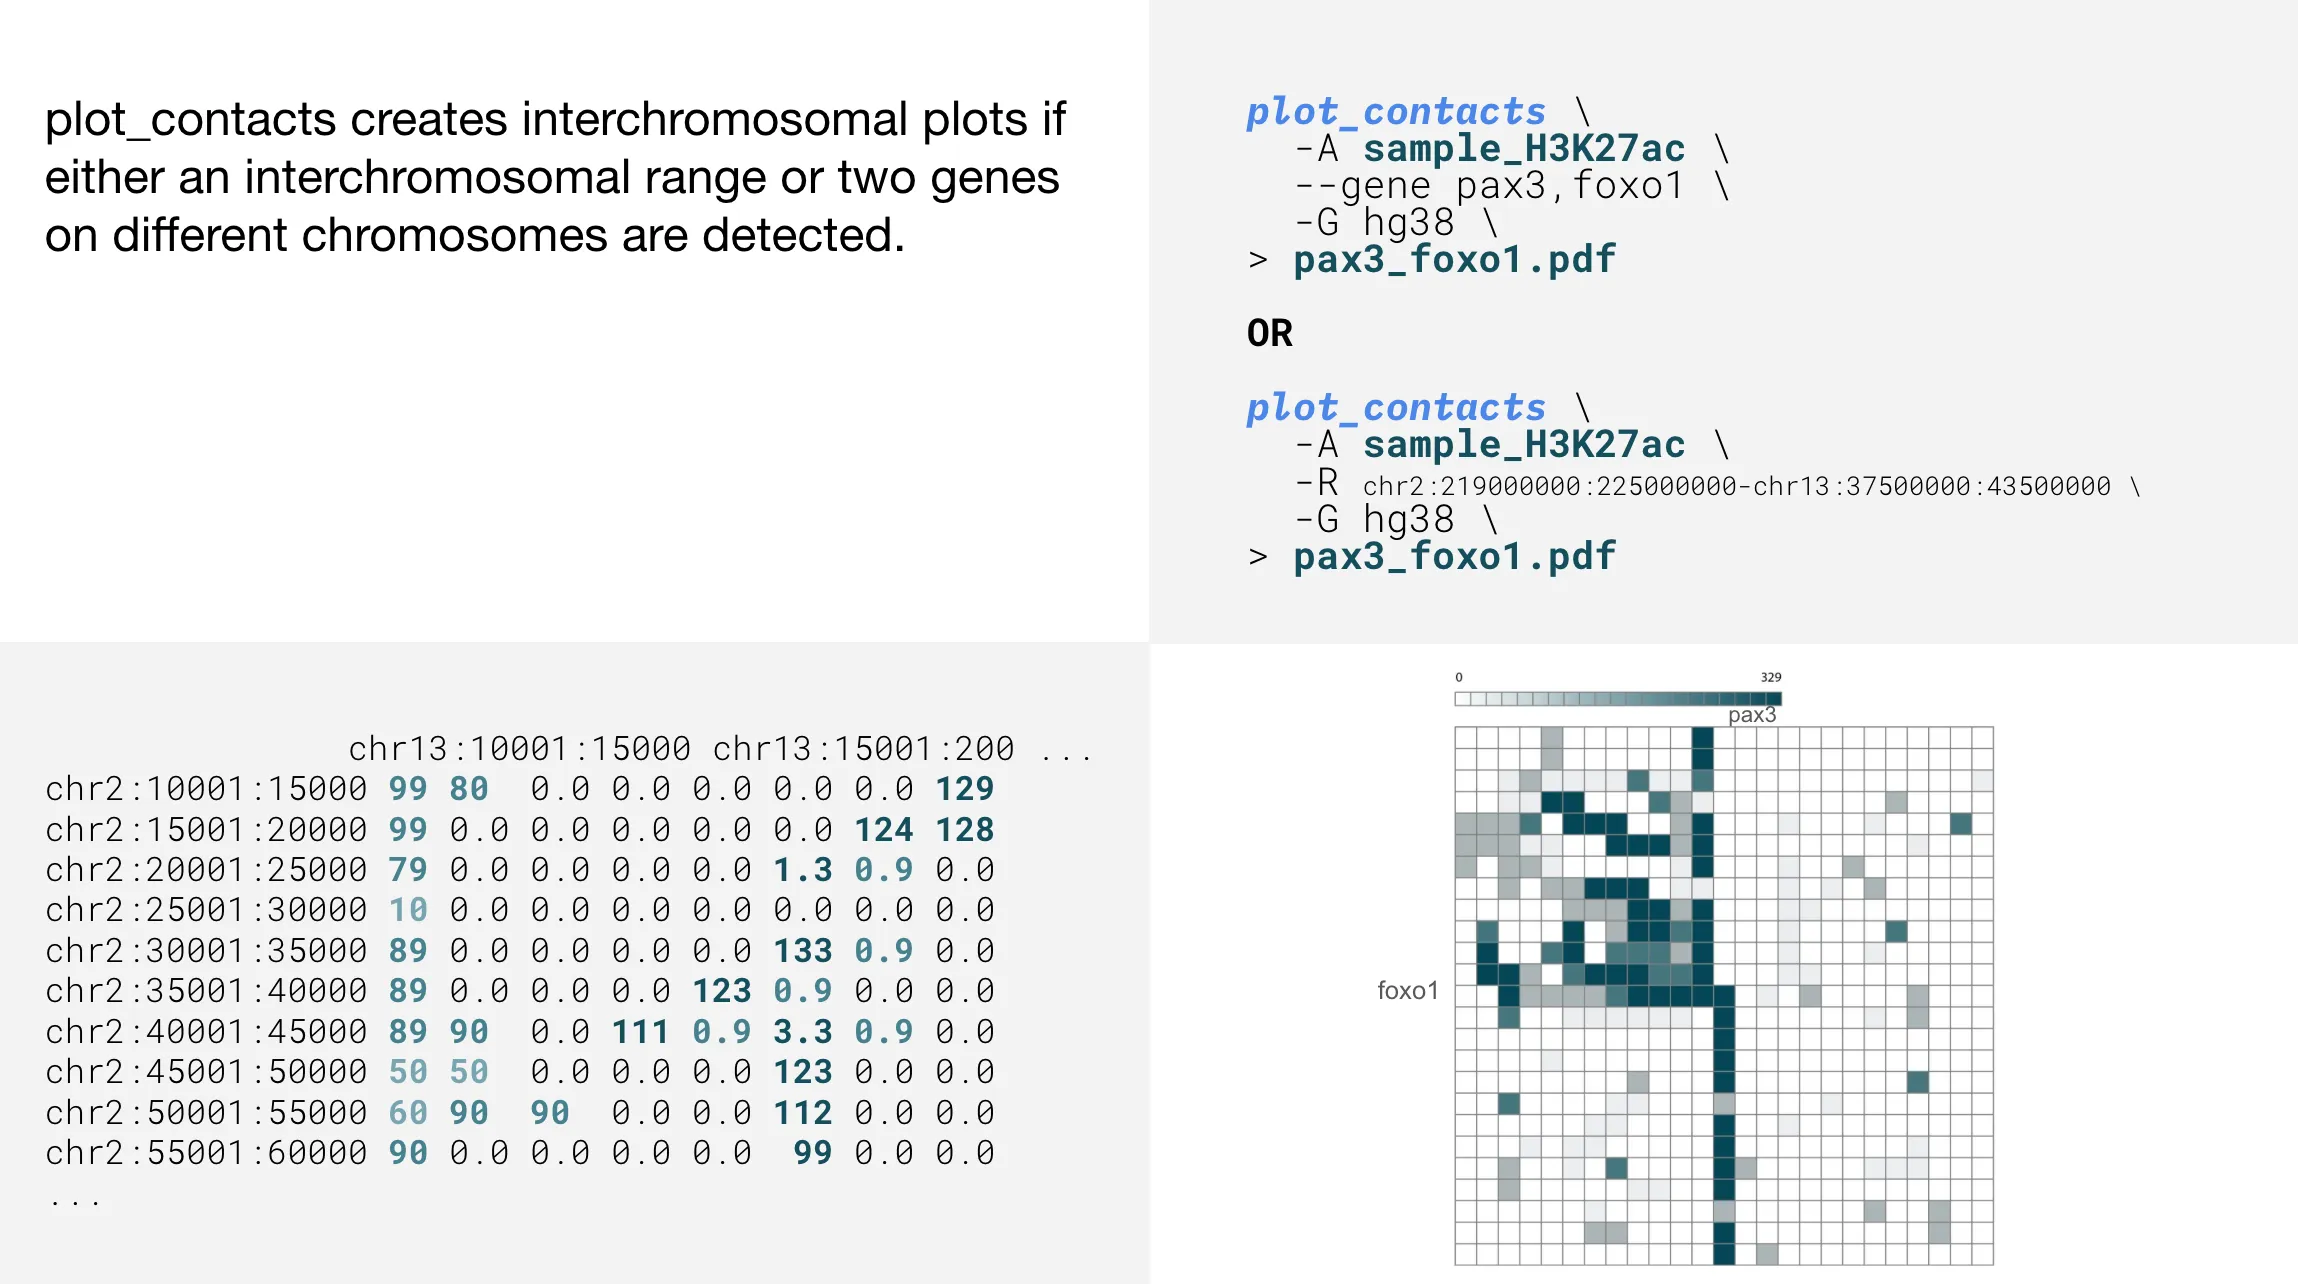
Interchromosomal plots
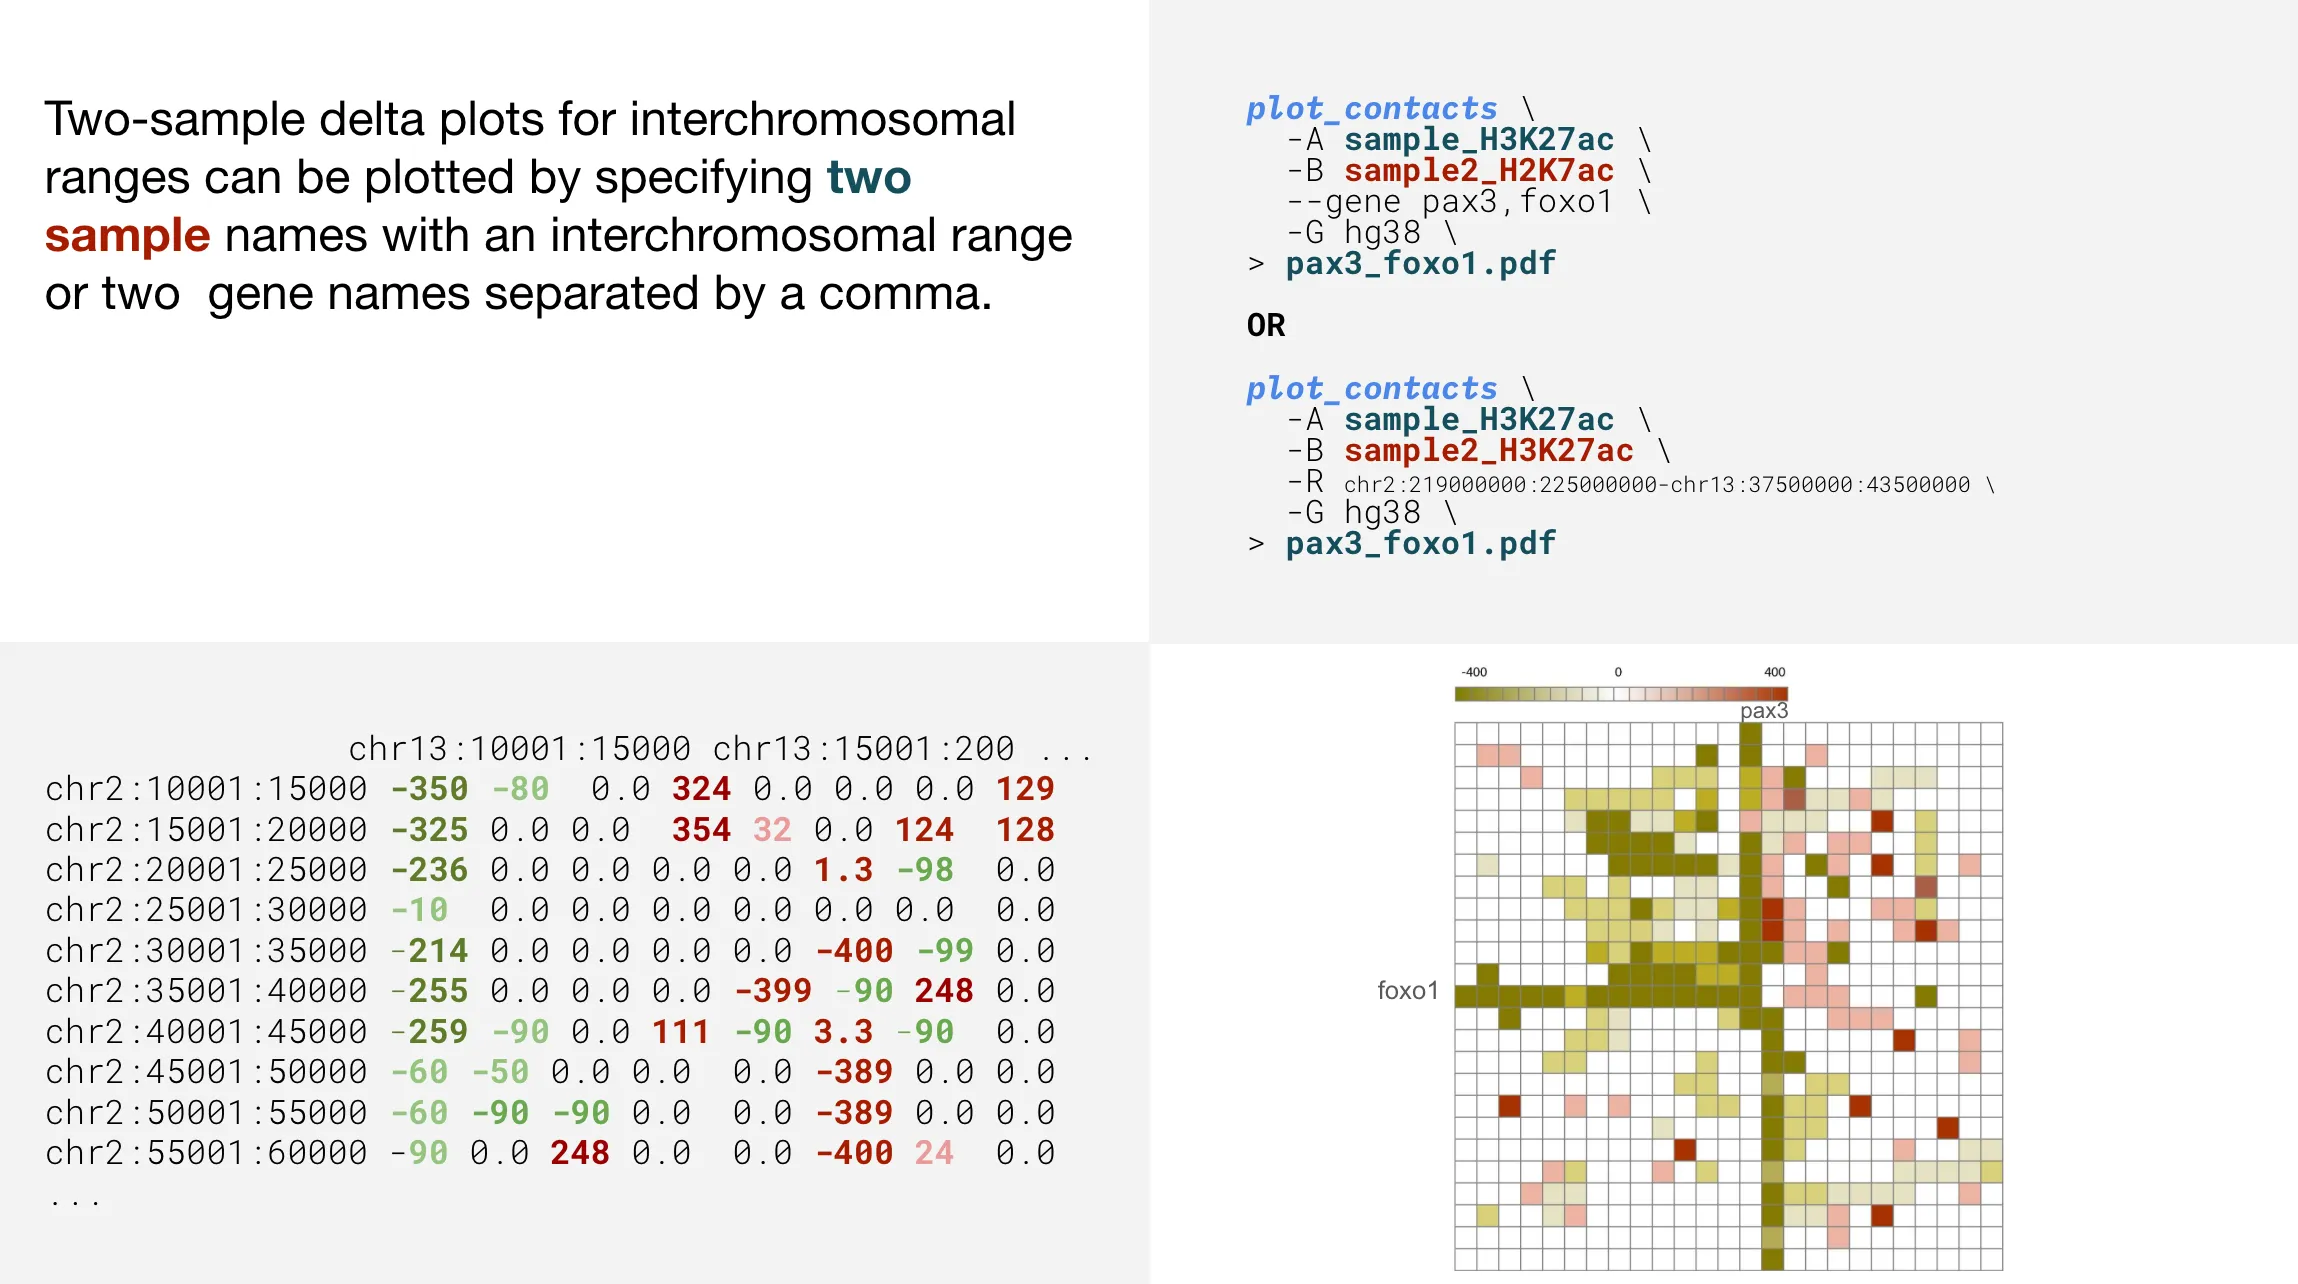
Two-sample interchromosomal plots
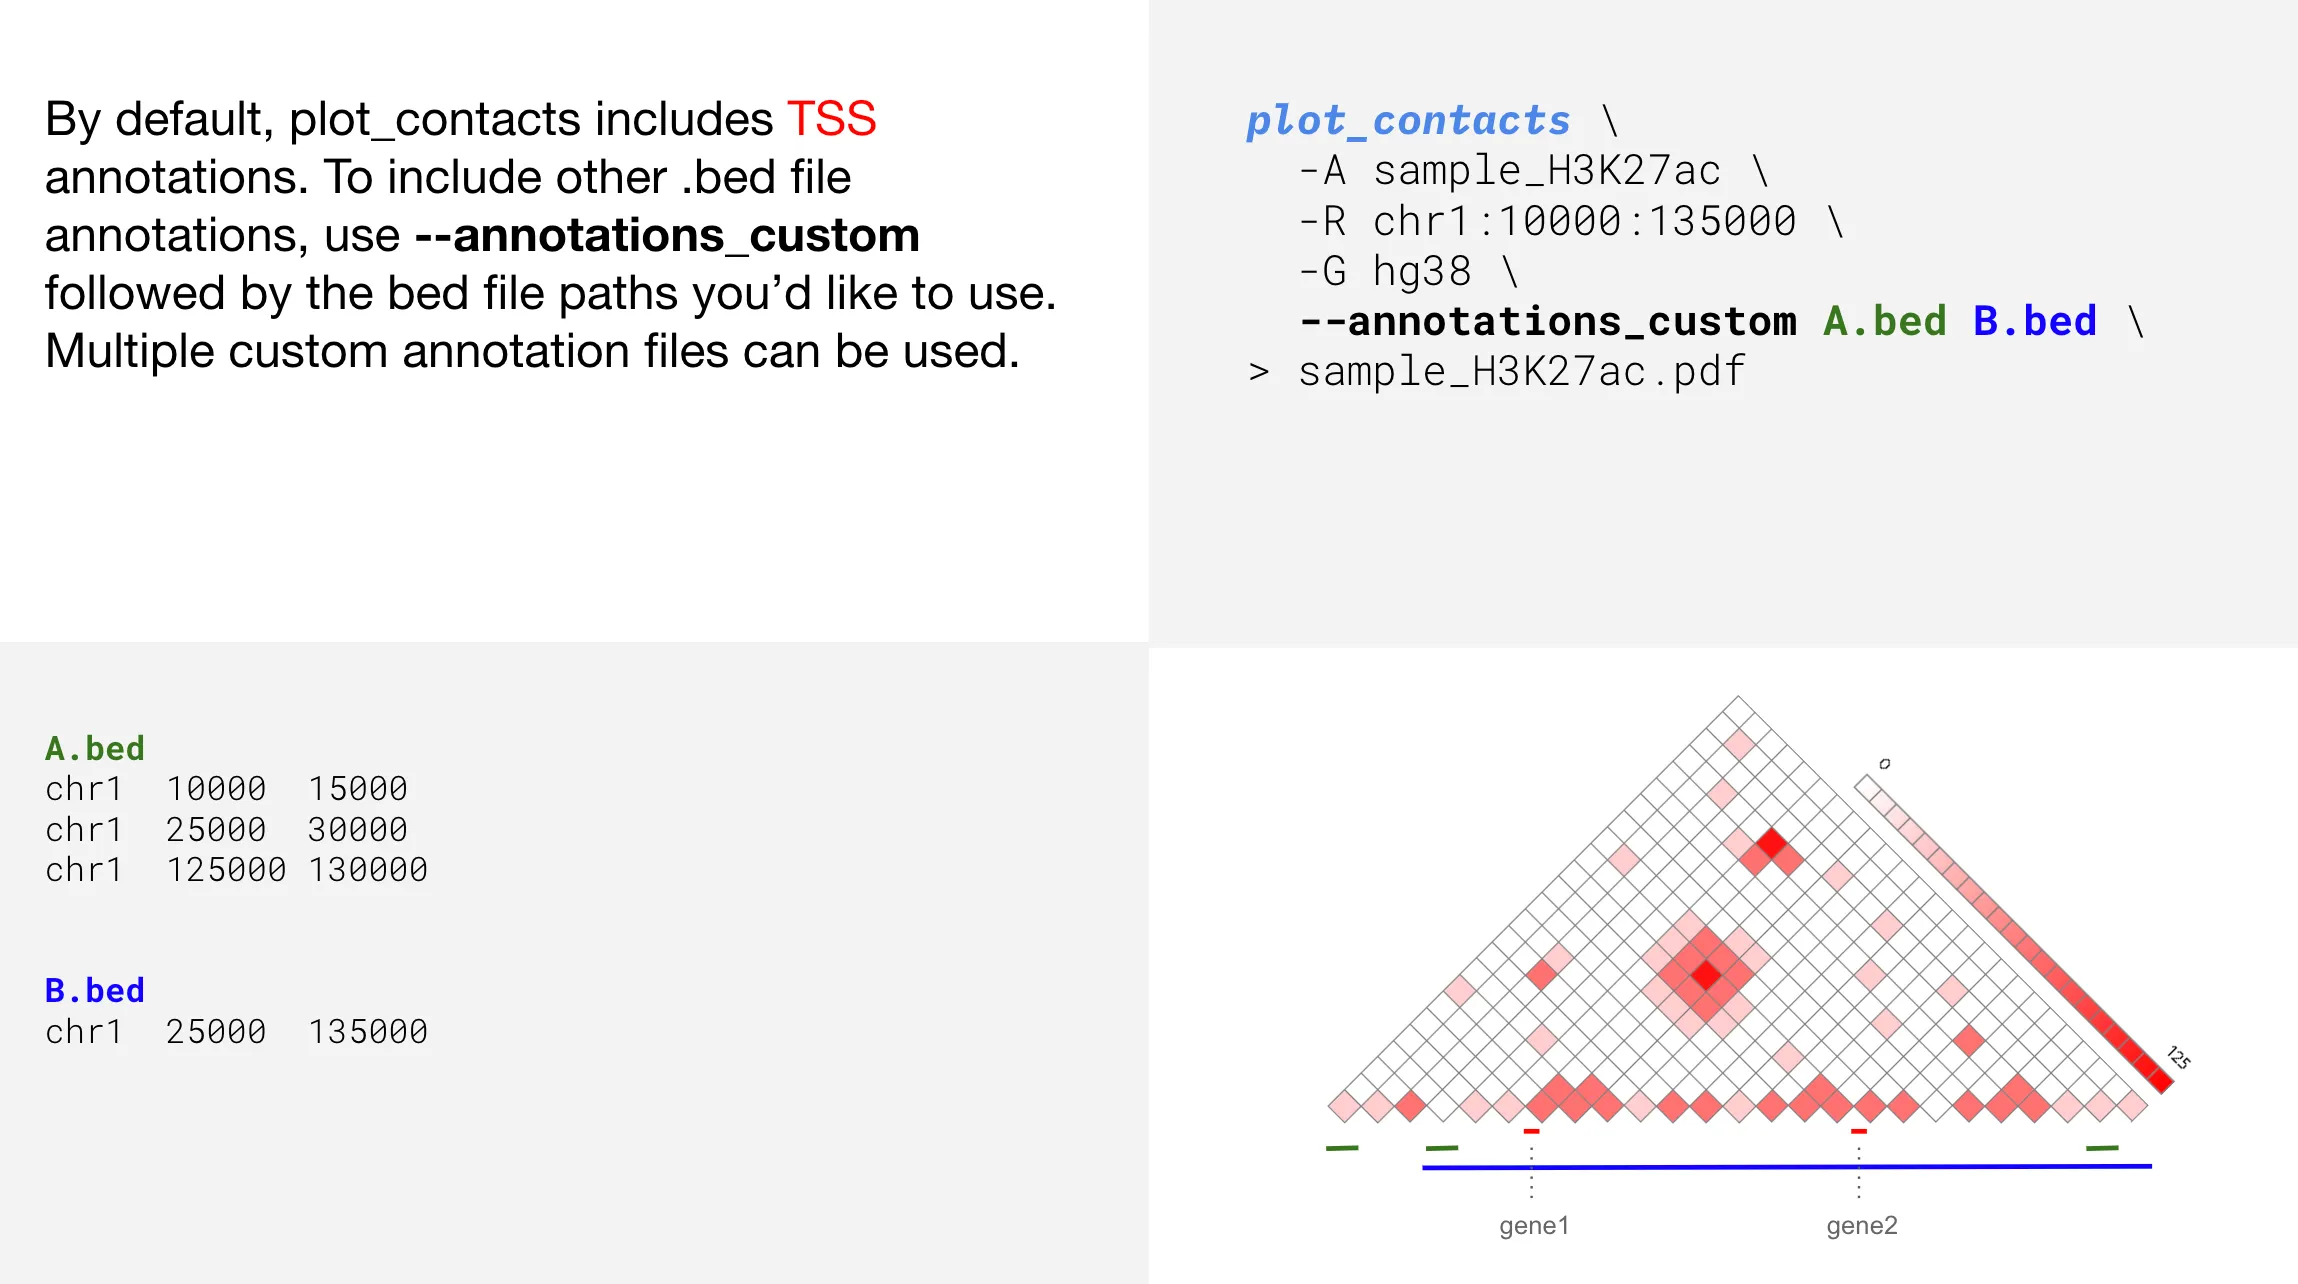
Adding custom annotations
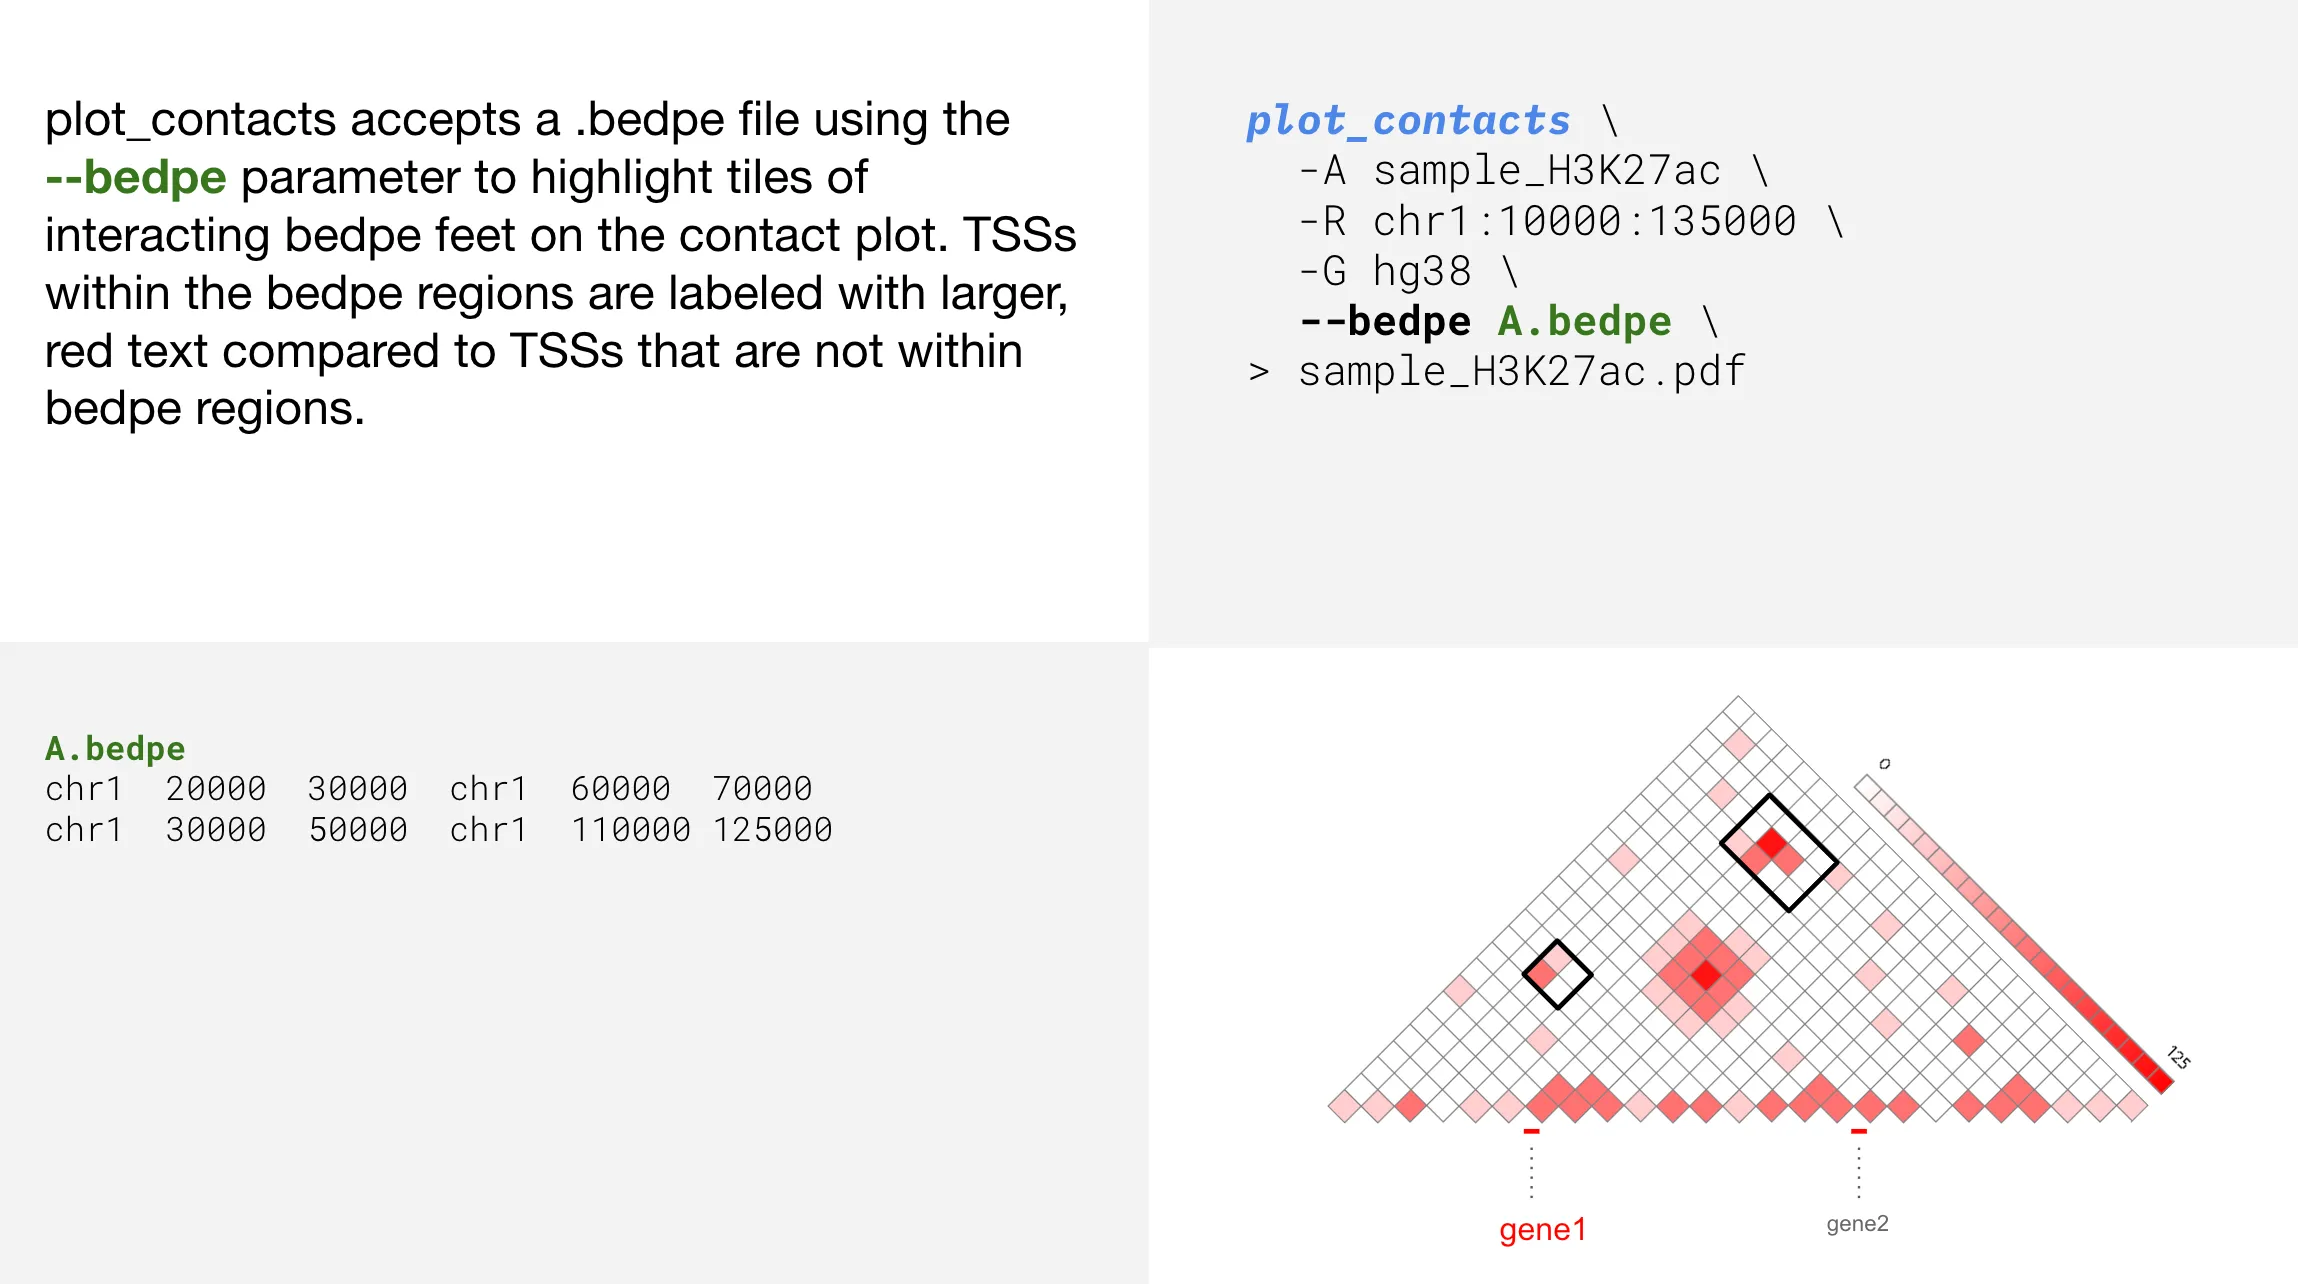
Adding bedpe highlights
Usage
Usage and Option Summary
plot_contacts -A H3K27ac -R chr1:40280000:40530000 -G hg38(or):
plot_contacts -A H3K27ac -B H3K27me3 -g MCC7_MYCL -G hg38Required
| Short Option | Long Option | Description |
|---|---|---|
-A | --sample_1 | Name of the sample as it appears on the Tinkerbox |
-R | --range | The genomic range that is to be plotted, in chr:start:end format. Example: -R chr1:40280000:40530000. For interchromosomal pairs use chr1:start1:end1-chr2:start2:end2 format. Example: chr2:219000000:225000000-chr13:37500000:43500000 |
-G | --genome | The genome build the sample(s) has been processed using: hg19, hg38, or mm10 |
Optional
| Short Option | Long Option | Description |
|---|---|---|
-O | --output_name | Optional name for the plot |
-B | --sample_2 | For two sample delta plots, name of the second sample |
-Q | --norm | Which normalization to use. Strictly ‘none’, ‘cpm’ or ‘aqua’ in lower case. Non-spike-in samples default to cpm. Spike-in samples default to aqua |
-r | --resolution | Resolution of sample in base pairs. Default 5000. Accepted resolutions- 1000,5000,10000,25000,50000,100000,250000,500000,1000000,2500000 |
-o | --color_one_sample | Color for contacts for single sample plots in RGB hexadecimal, ex: red = FF0000 (RRGGBB). Default = FF0000 |
-t | --color_two_sample | Color for contacts for two sample plots (delta) in RGB hexadecimal separated by ’-’, ex: 1E90FF-C71585 |
--annotations_default | Draw bed TSS annotations. Default TRUE | |
--annotations_custom | Path to bed file(s) for custom annotations; —annotations_custom 1.bed 2.bed | |
--quant_cut | Cap matrix values at a given percentile (0.00-1.00). Default 1.00 | |
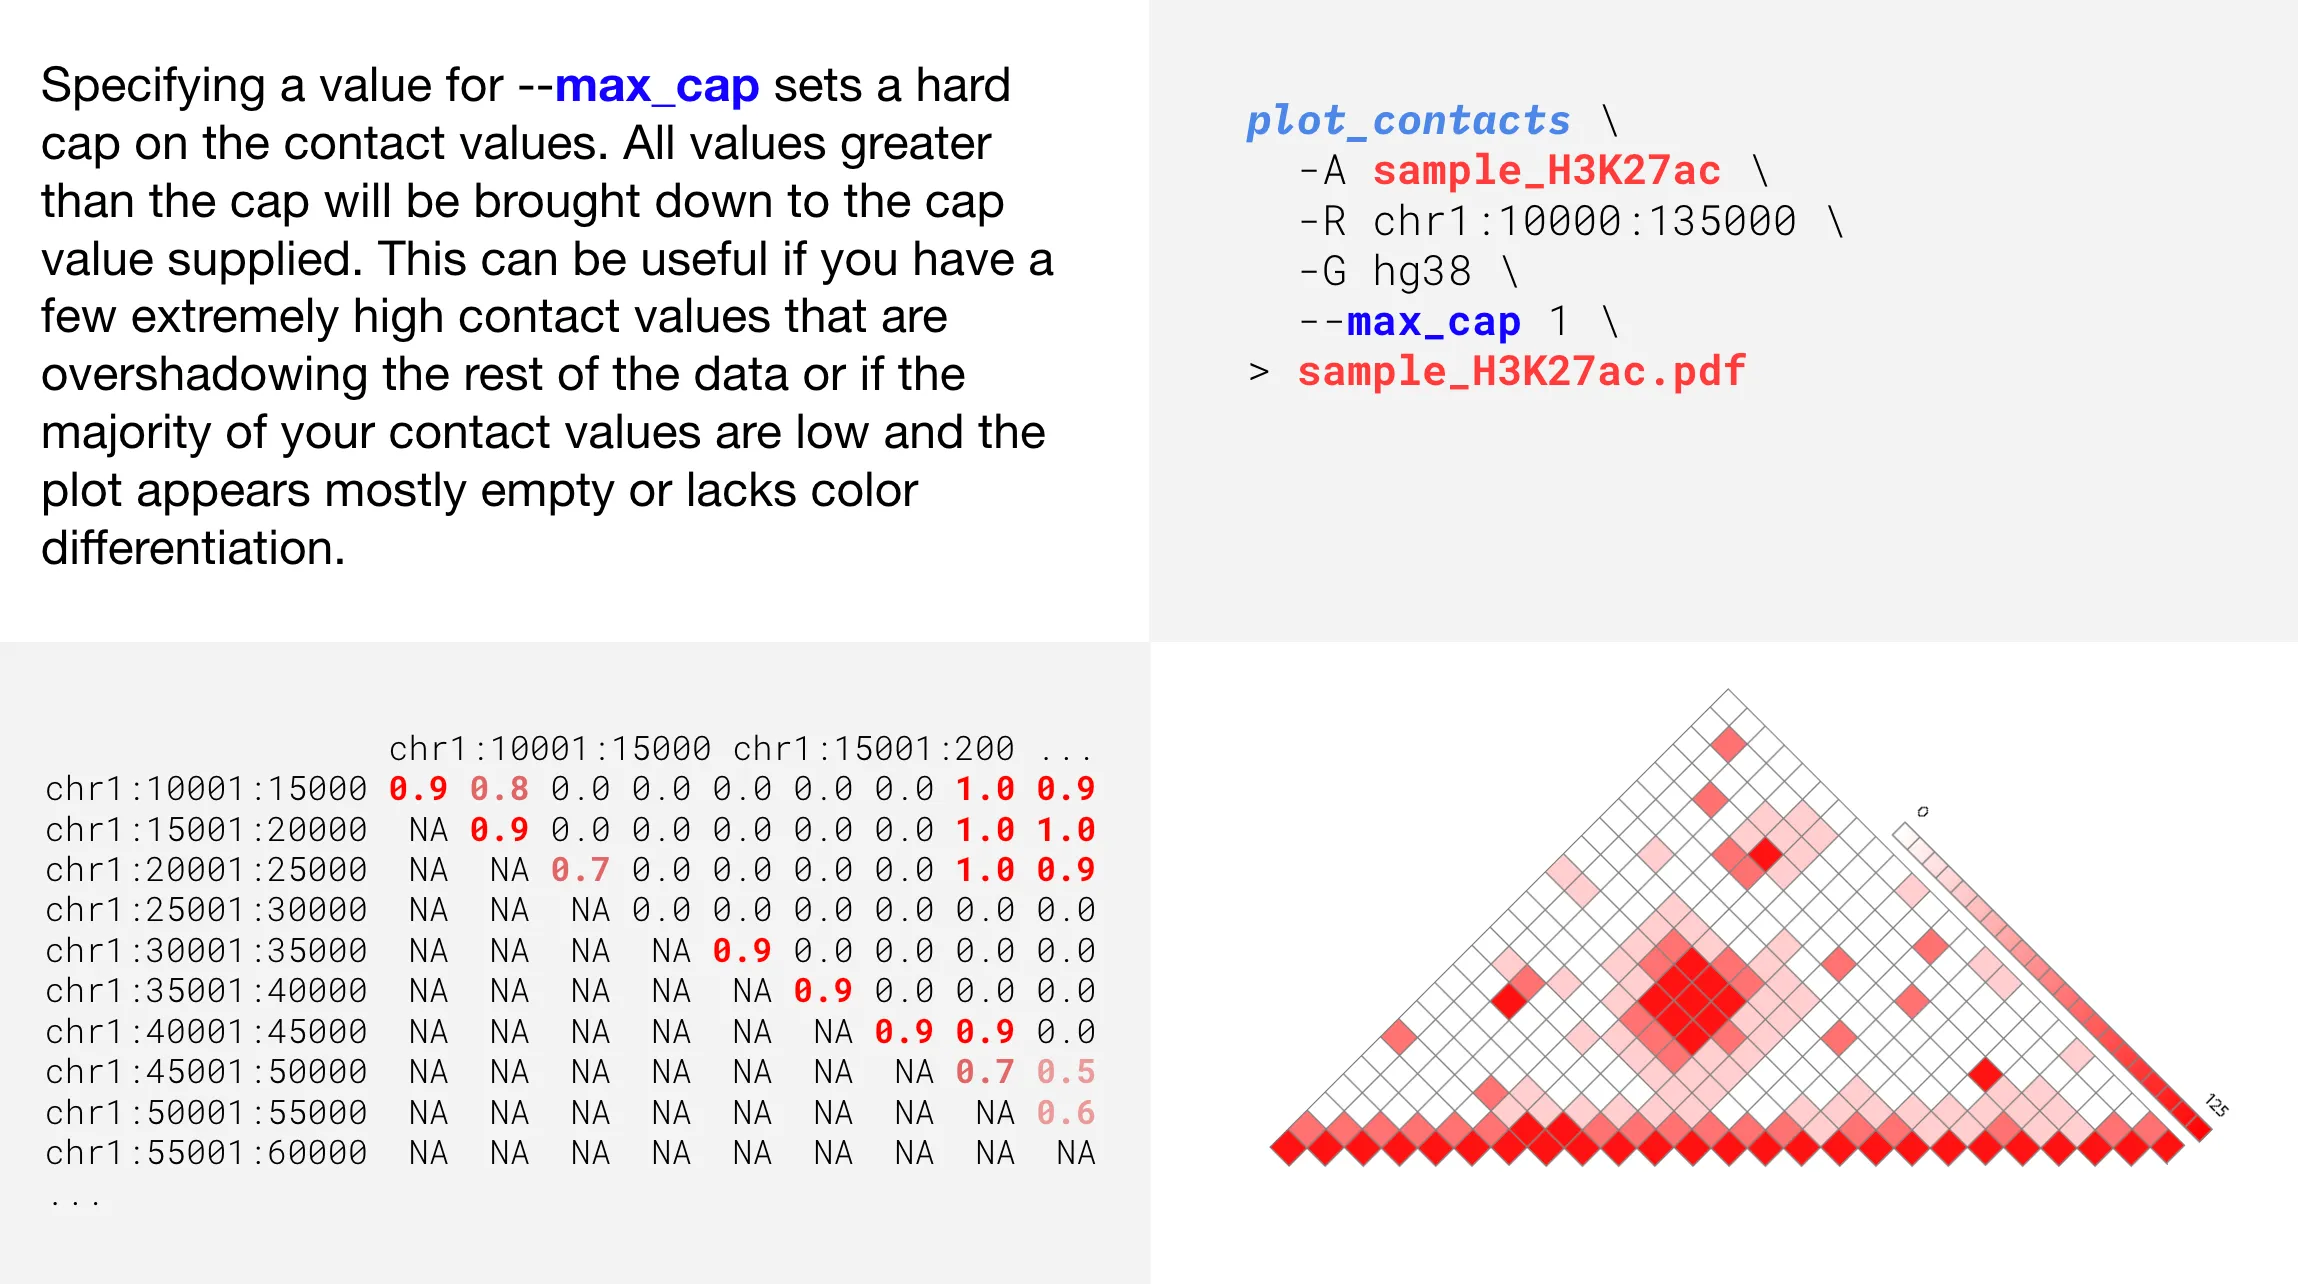
--max_cap | Cap matrix values by adjusting the maximum value, modifying color intensity | |
--get_matrix | Obtain raw contact matrices instead of contact plot. Default FALSE | |
--bedpe | Path to a bedpe file to highlight tiles of interacting bedpe feet | |
--bedpe_color | Color for supplied bedpe in RGB hexadecimal. ex: C71585 | |
-i | --inherent | If TRUE, normalize contacts using inherent normalization. Default FALSE |
--inh_col_floor | Contact color for inherent values < 0, in RGB hexadecimal. Default = FFFFFF | |
--inh_col_off | Contact color for inherent values ~ 0, in RGB hexadecimal. Default = D4E4FB | |
--inh_col_on | Contact color for inherent values ~ 1, in RGB hexadecimal. Default = FF0000 | |
--inh_col_ceil | Contact color for inherent values > 1, in RGB hexadecimal. Default = FF8D4A | |
-w | --width | Manually set width of printed bin between 0 and 1. Default width calculated automatically. |
-g | --gene | Provide a gene name instead of an interval range (-R). Example: —gene sox8. For interchromosomal pairs use gene1,gene2. Example: pax3,foxo1 |
-f | --flank | Change interval range by flank value in bp; —flank 5000 |
-h | --help | Help message |